Patrick Campbell, CEO at ProfitWell, studied 3,000+ subscription companies to find average revenue churn across dimensions including company age and price point.
Patrick Campbell, CEO at ProfitWell:
We studied 3,000+ subscription companies to find average revenue churn across dimensions including company age and price point.
Three key findings:
1. Churn Loosely Correlates With MRR
Churn is much higher than typically disclosed. When looking at company size, churn loosely correlates with monthly recurring revenue, fluctuating between 5% and 16% gross revenue churn on the low end of MRR and 2% to 8% on the high end.
You’d expect a company to figure out their churn as they grow. This isn’t the case.
2. Company Ages Show Survivor Bias
Older companies have dramatically lower churn than their younger counterparts. Companies less than three years old see a spread from 4% to 24%, whereas companies 10+ years old see churn from 2% to 4%.
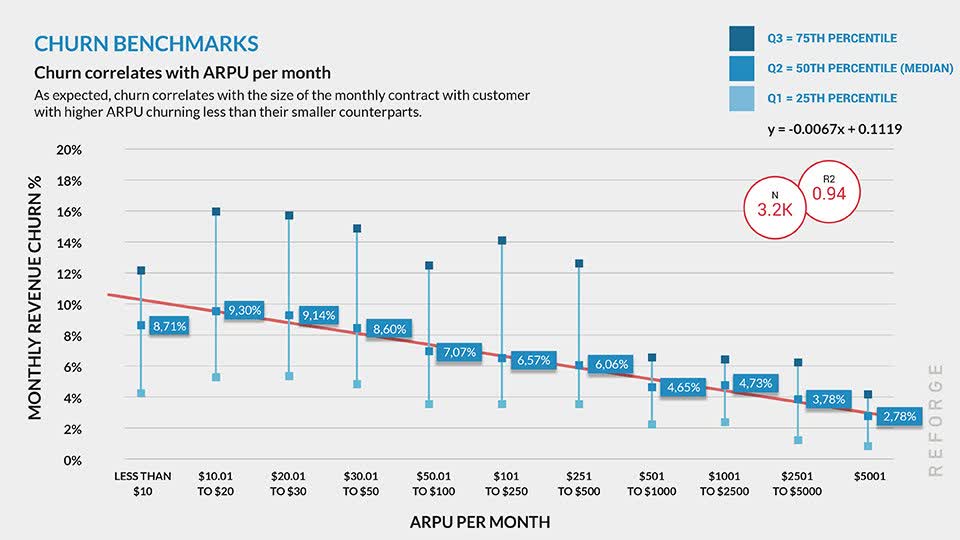
3. Pricing Influences Churn
Companies with low ARPUs see much higher churn than those with larger ARPUs. If average revenue per user per month is below $100, you’ll see monthly gross dollar churn rates between 3% and 16%, with a median between 6% and 9%. ARPUs over $500 see significantly less revenue churn, ranging from 2% to 6% with a median closer to 3% to 4%.
Summarized by Reforge. Original article by Patrick Campbell • CEO @ ProfitWell