North Star Metrics measure the success of your growth & marketing efforts. Learn how to pick & measure the most impactful ones with our new guide + template.
Users are key to growing a business — but it’s important to recognize that not all users, or the actions they’re taking, are created equal. Some actions meaningfully create value in our growth model, and some just don’t.
In this lesson from Reforge’s Brand Marketing program, we will cover how to identify and establish meaningful North Star Metrics for each North Star goal so that you can accurately and efficiently measure your brand marketing efforts, steer your overall marketing strategy, and successfully drive growth.
In This Preview:
What is a North Star Metric?
What makes North Star Metrics different from input metrics?
3 Components of a North Star Metric
How to Choose North Star Metrics, including deep dives on defining metrics for Acquisition, Retention, and Monetization
The North Star Metrics Template (Reforge members only)
There are two types of metrics that marketing leaders need to know well: North Star Metrics and input metrics.
What is a North Star Metric?
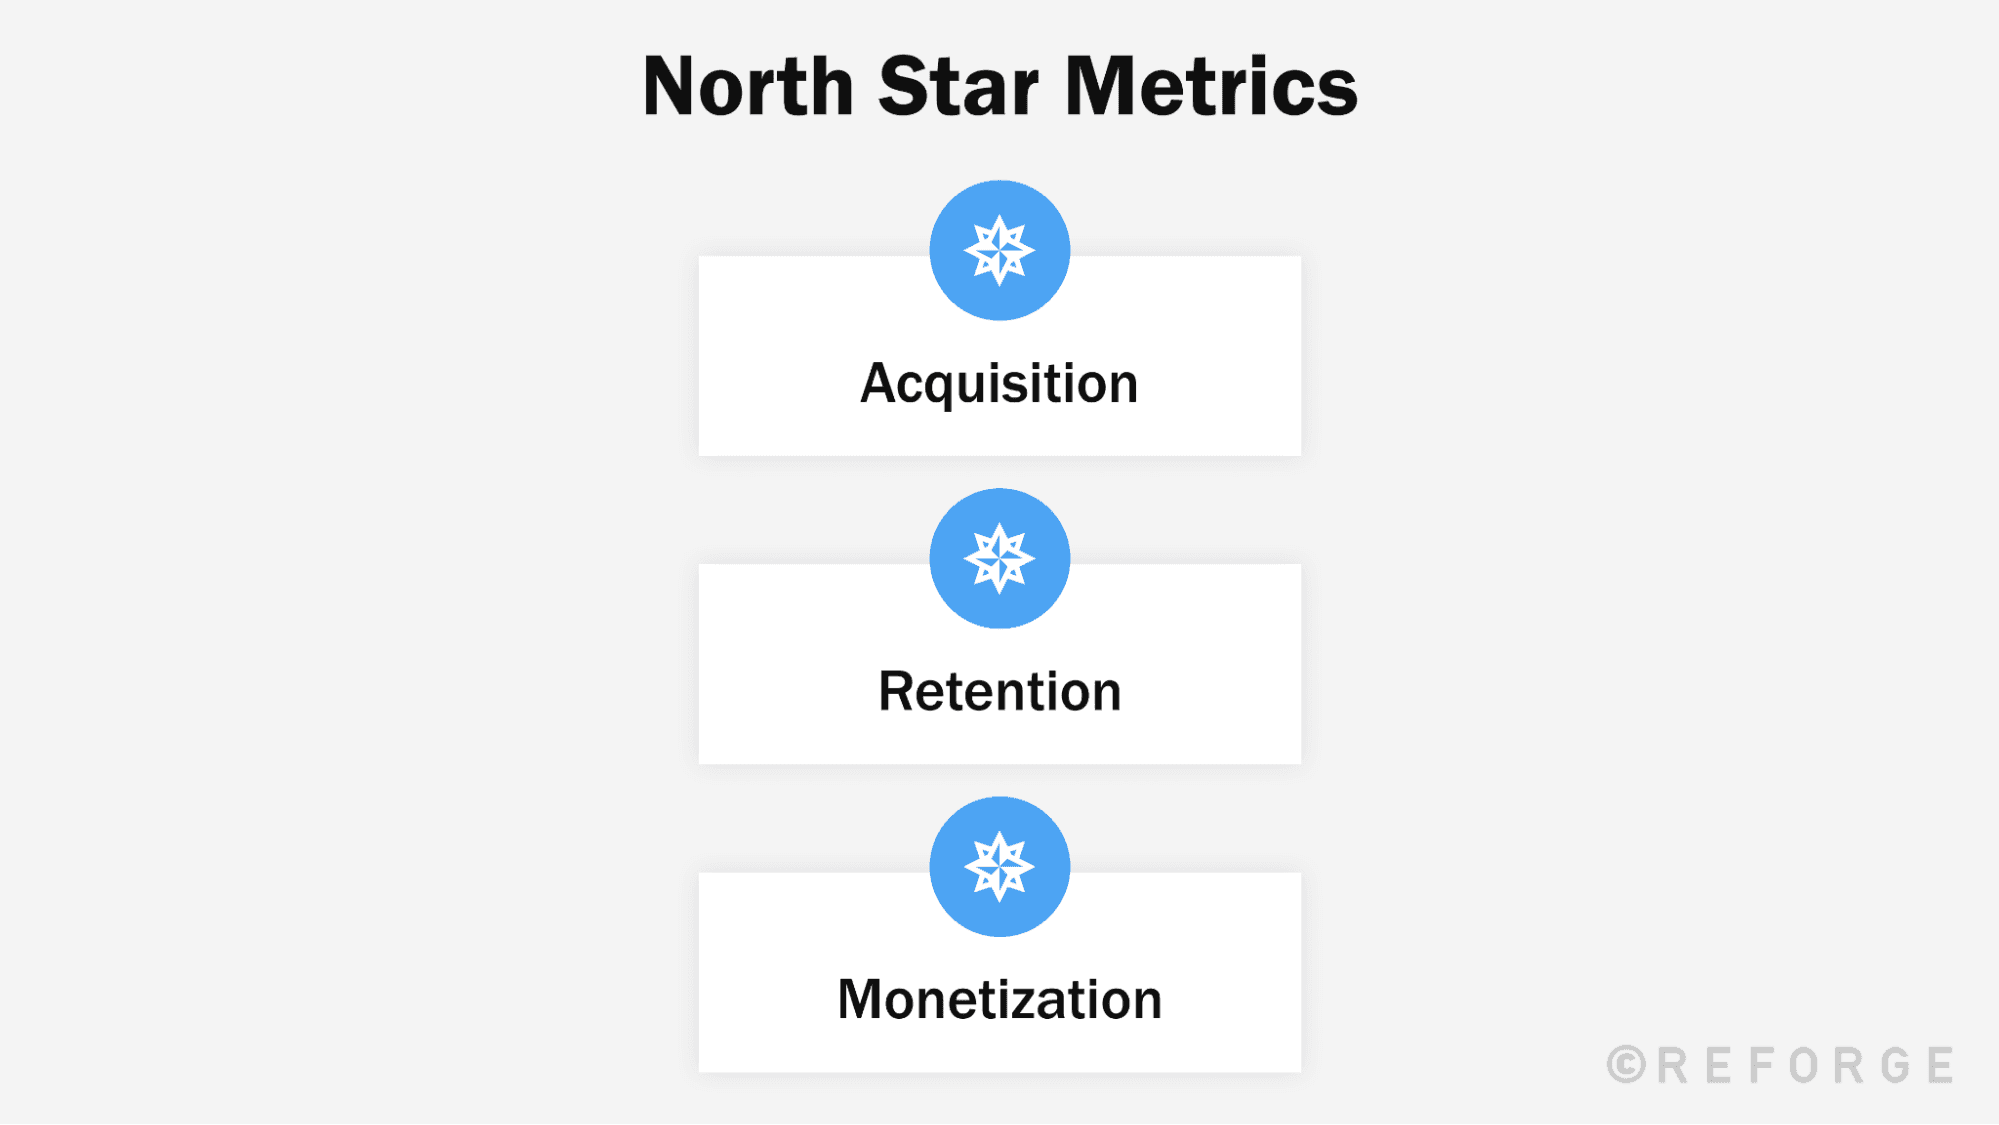
North Star Metrics are the primary outcome metrics that measure the success of a company’s overall strategy. Products almost always have multiple North Star Metrics to capture the many dimensions of the business that determine its health.
But most businesses typically have three primary North Star Metrics: acquisition, retention, and monetization.
Your team — as a department, function, or business unit — may want to focus on all or some of those North Star Metrics. North Star Metrics will guide most, if not all, of your cross-domain work and collaborations.
What makes North Star Metrics different from input metrics?
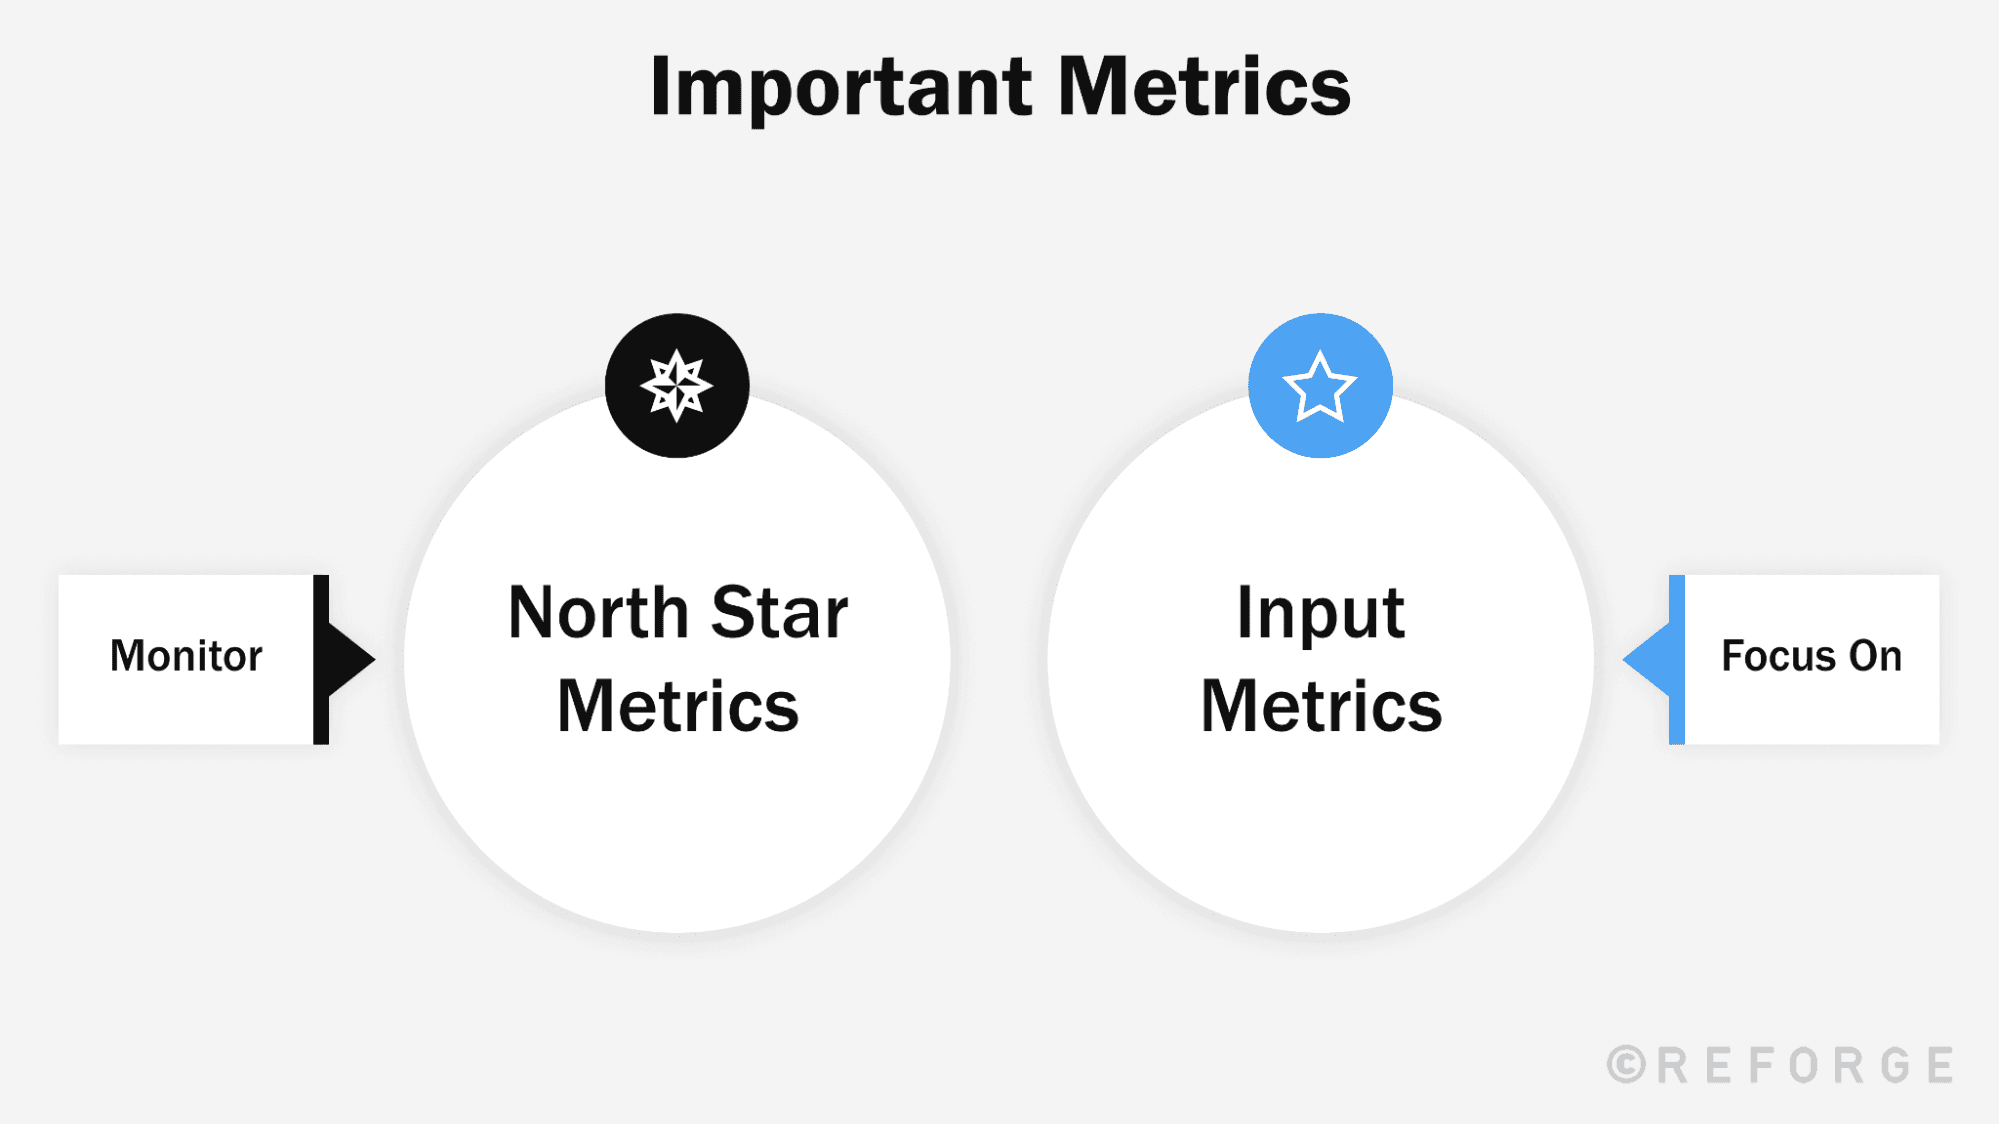
Input metrics represent the actions that drive your North Star Metrics. These should be leading indicators that cause, or are at least highly correlated with, our North Star Metrics. You will have a different set of input metrics for each domain.
We need input metrics because you can’t focus exclusively on North Star Metrics. They’re too big, too broad, and not actionable — simply put, they are a scoreboard.
To win the game, you need to focus on the individual plays that drive the score. Although you should monitor North Star Metrics to ensure you’re driving the right outcomes, your strategy needs to focus on the input metrics you can directly influence.
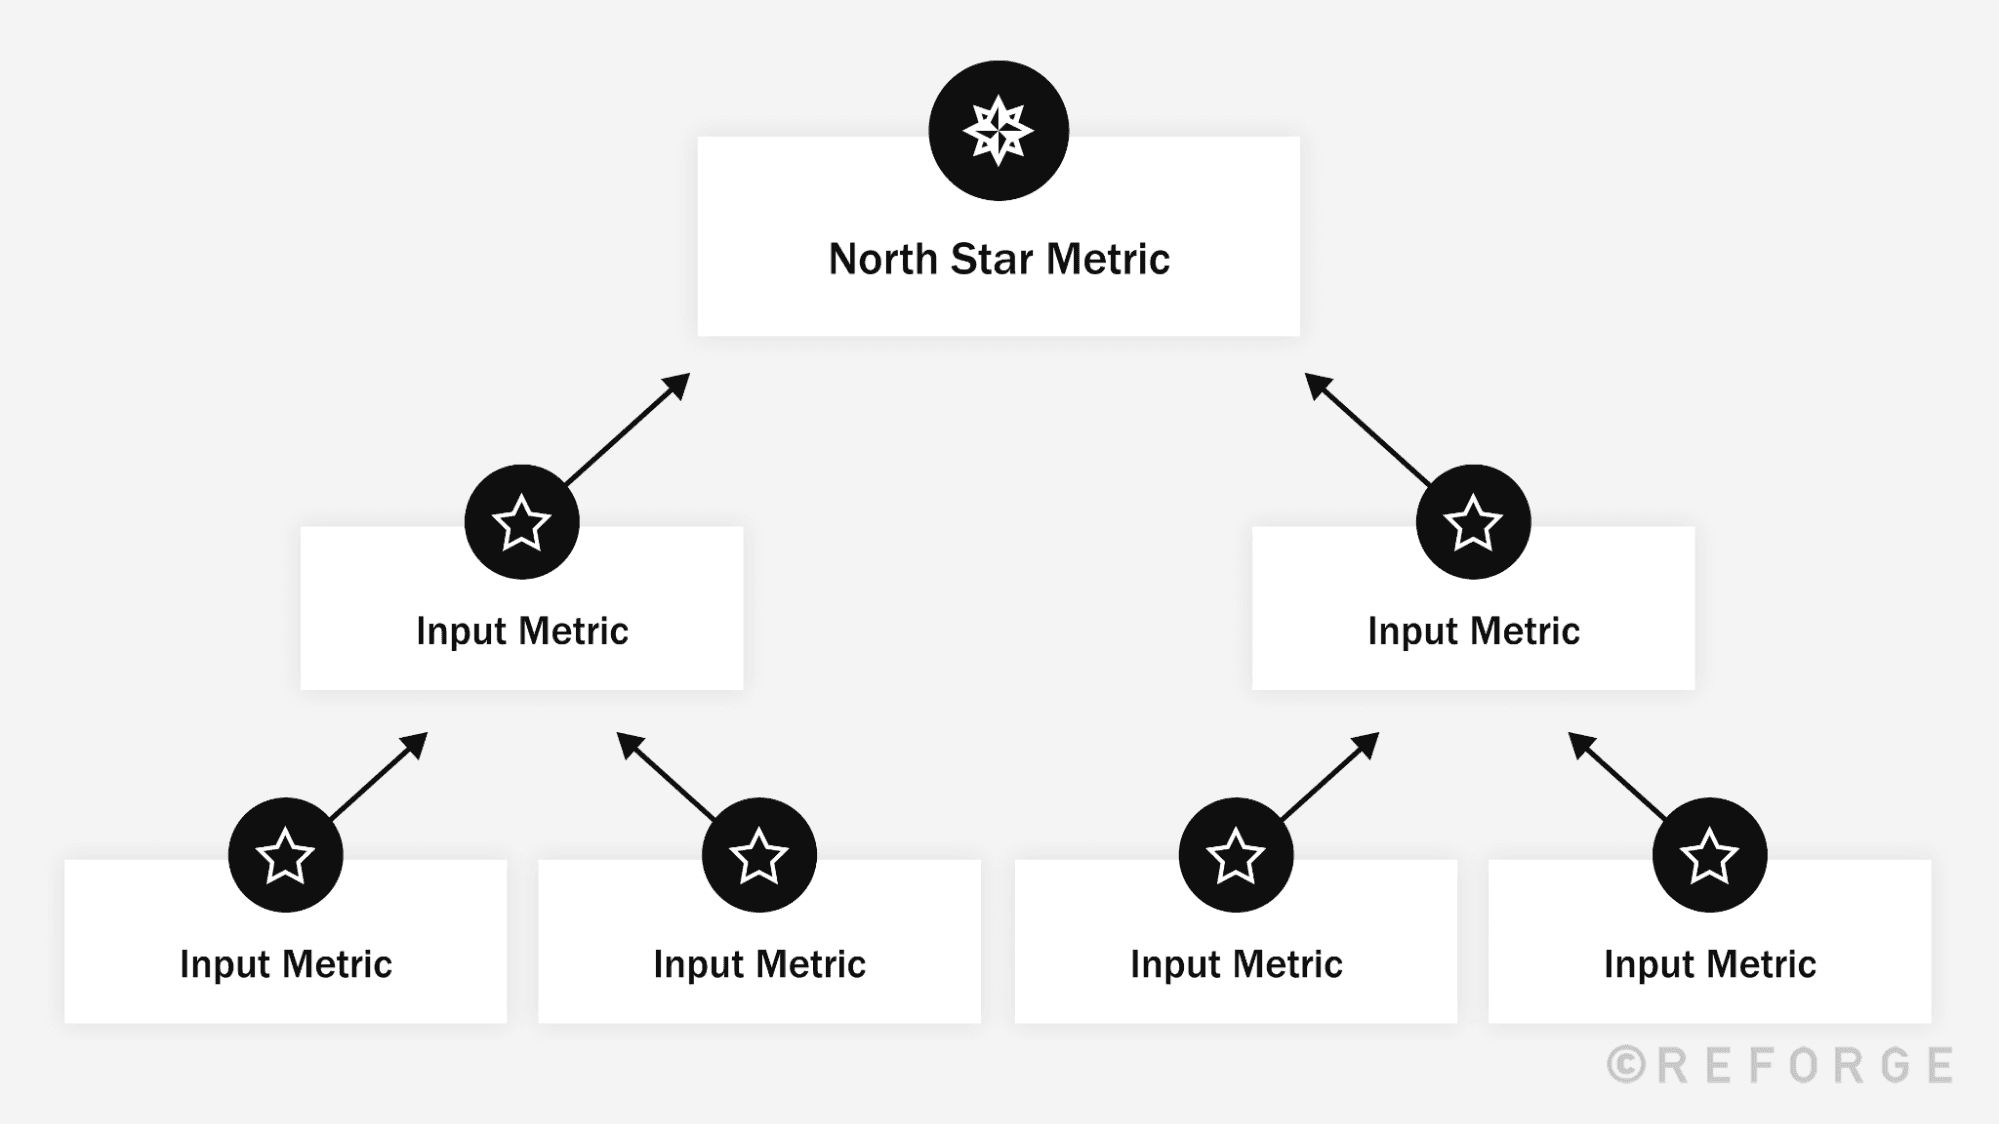
Together, North Star Metrics and input metrics form the constellation of metrics that growth leaders monitor and optimize for in order to drive growth outcomes.
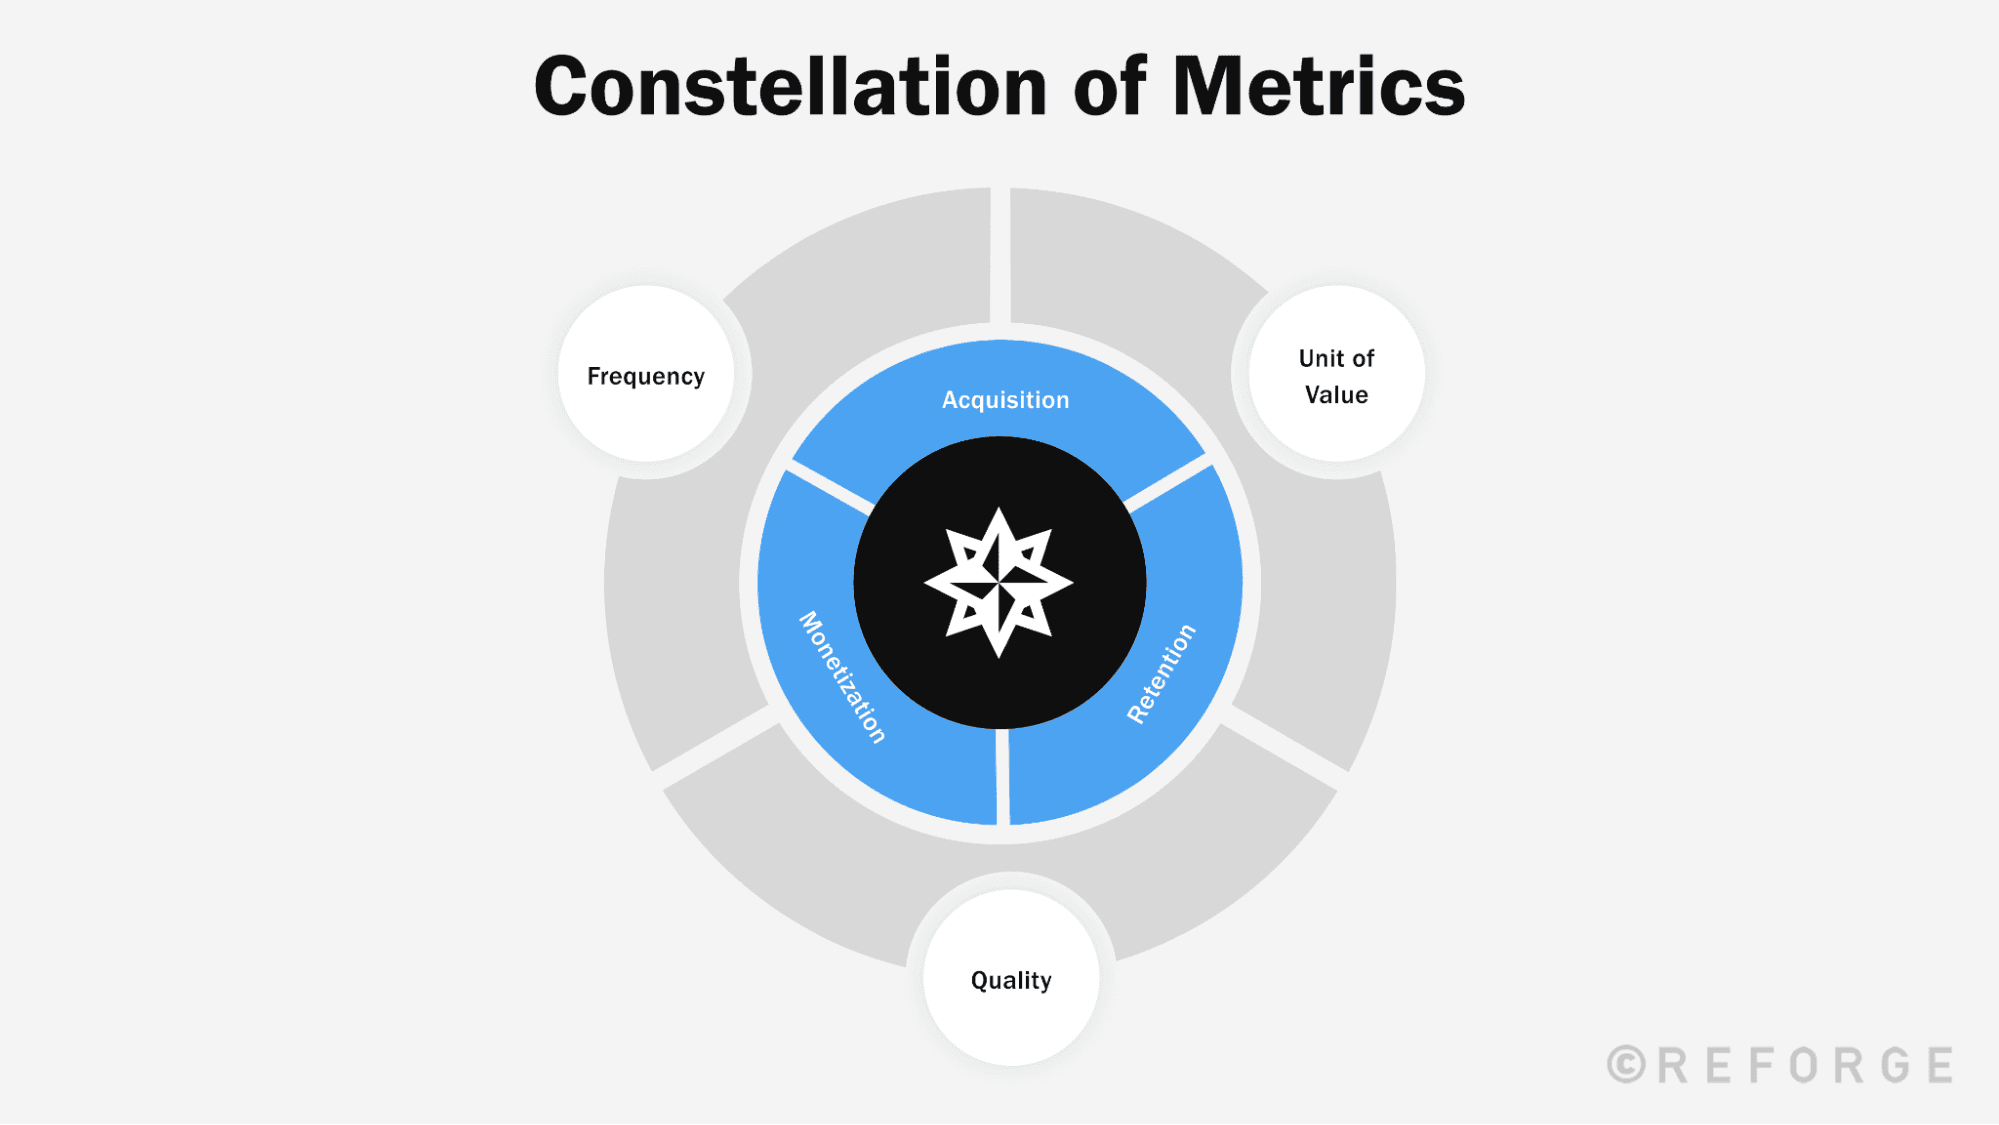
3 Components of a North Star Metric
Each of the three primary North Star Metrics — acquisition, retention, and monetization — can be defined through three components:
Unit of Value: What we’re measuring
Quality: What type of value “counts.”
Frequency: Defining the relevant timeframe.
When taken together, unit of value, quality, and frequency ensure that your North Star metrics are clear and actionable.
When this clarity is missing, our North Stars can seem aspirational, murky, or slide into becoming "big hairy audacious goals," or BHAGs.
While BHAGs can be useful tools for building motivation and reinvigorating the team around a long term initiative, they don’t provide great direction for actually developing and running a multi-channel strategy.
For example, let's say that you're at Slack and your big hairy audacious goal is to launch a new video conferencing feature, and ultimately become the number one meeting tool in the US. If this is your North Star, how do you actually build a strategy around it? How do you define success since it's relative to other competitors?
As a growth leader, you often have to take aspirational objectives and translate them into North Star Metrics that provide operational and strategic clarity.
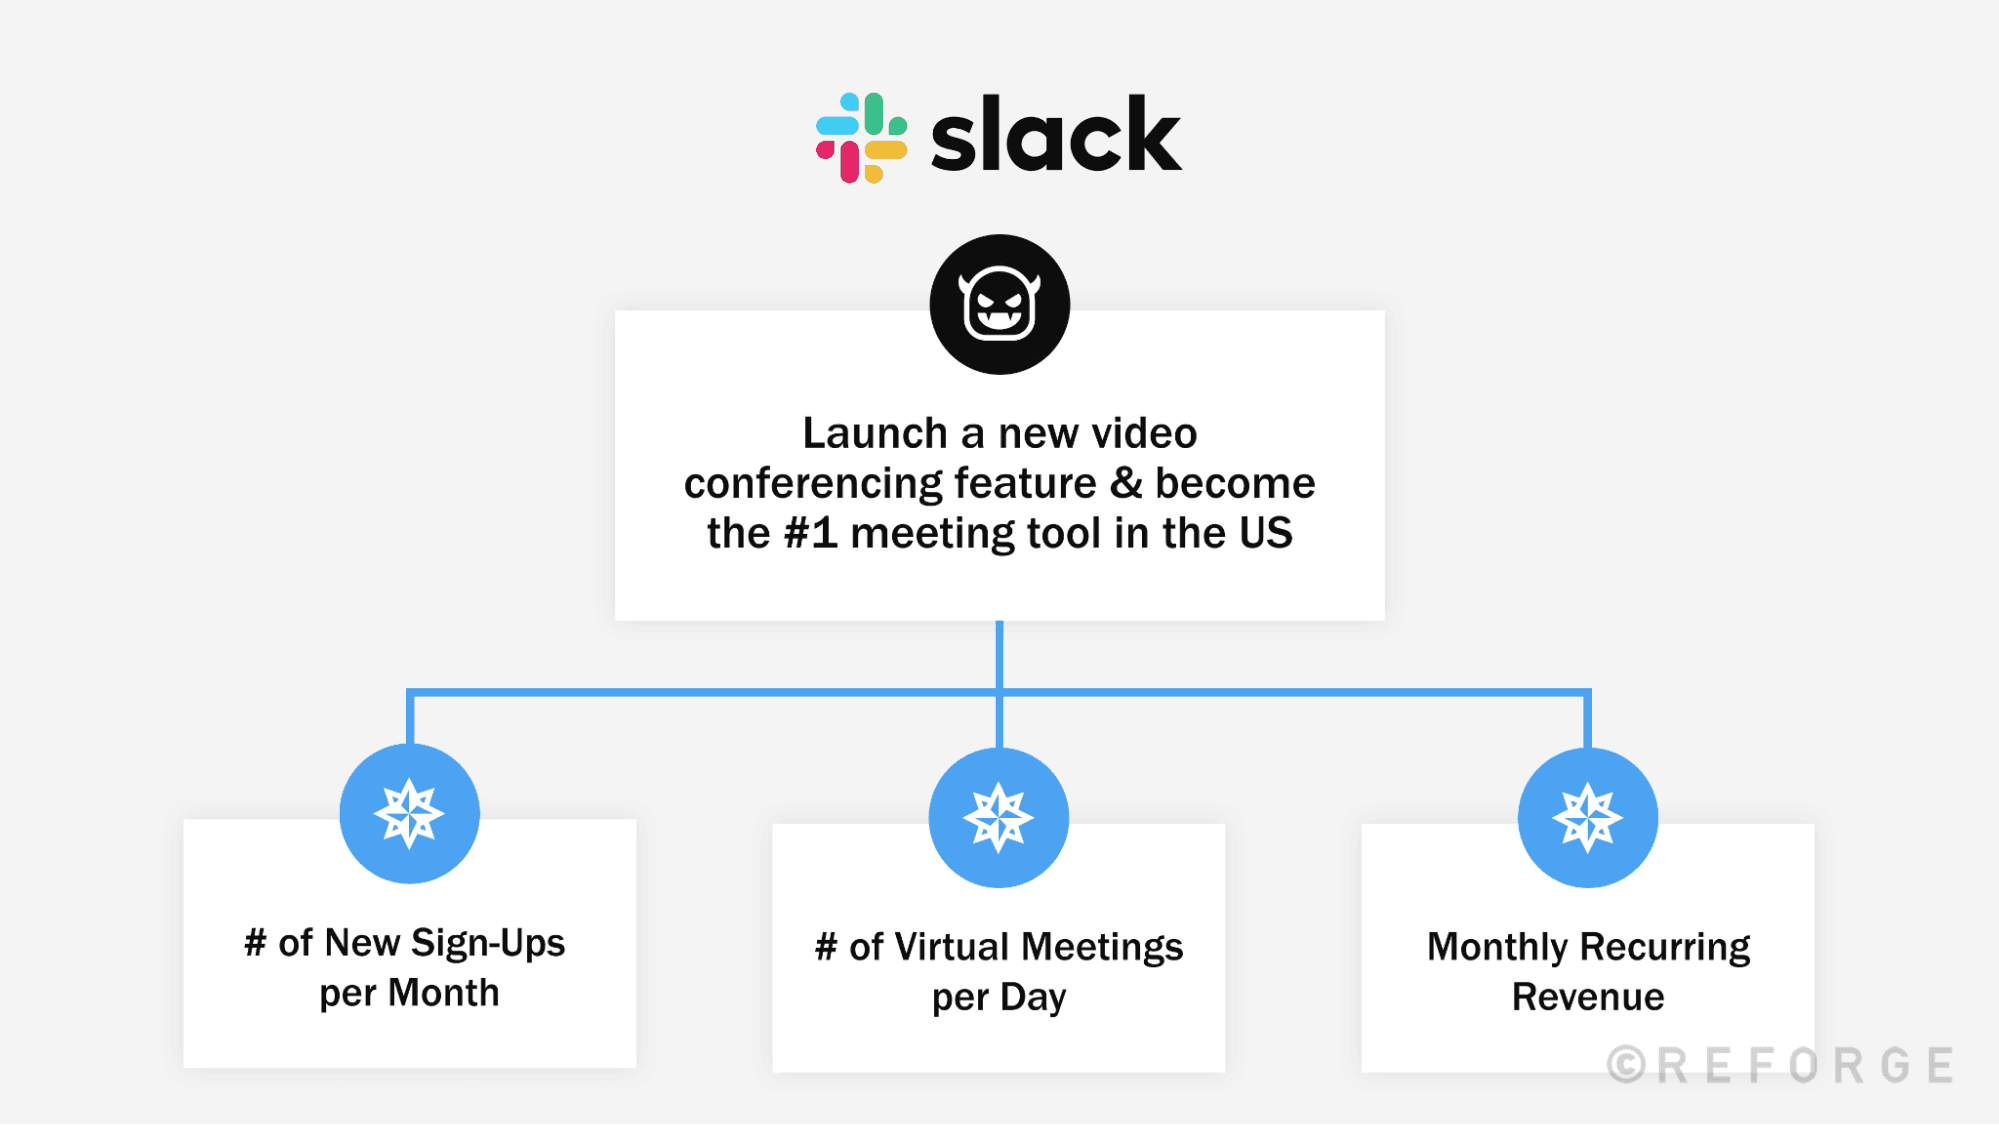
In the hypothetical example of Slack launching video conferencing, its North Star Metrics might include:
For acquisition: The number of new account sign ups per month
For retention: The number of virtual meetings users hold per day
For monetization: Monthly recurring revenue (MRR)
Once you’ve identified these North Stars, you can then identify what a virtual meeting use case would look like, as well as where you can access users who would be interested in them, allowing you to get a clearer marker of success — in other words: Did they use your new feature, or not?
This clarity is important for how you define strategy, but it’s also critically important for showing the team how their work contributes to the goal.
How to Choose North Star Metrics
The way you define the components of your North Star Metric — unit of value, quality, and frequency — depends on which North Star Metric you’re trying to move. But the process for establishing your North Star Metric will follow the same three steps.
Further below, we’ll walk through the three steps, in more depth, for each of the North Star Metrics.
1. Define your “unit of value.”
Unit of value measures "what" value we are creating.
For acquisition, your unit of value should capture your volume of new users.
For retention, it should capture your “active” users.
And for monetization, your unit of value should capture dollars earned.
2. Establish the quality of your unit of value.
Quality measures are a sub-component of unit of value: they modify our unit of value to be more specific or adjust to nuance in the growth model.
It’s important to recognize that not all users, or the actions they’re taking, are created equal. Some actions meaningfully create value in our growth model, and some just don’t.
Let's consider G2, a peer-to-peer business software review site, as an example.
Visitors to the site from search engines are likely coming to read a review. But it's even more meaningful to measure visits from reviewers, since user-generated content increases acquisition and retention of all visitors.
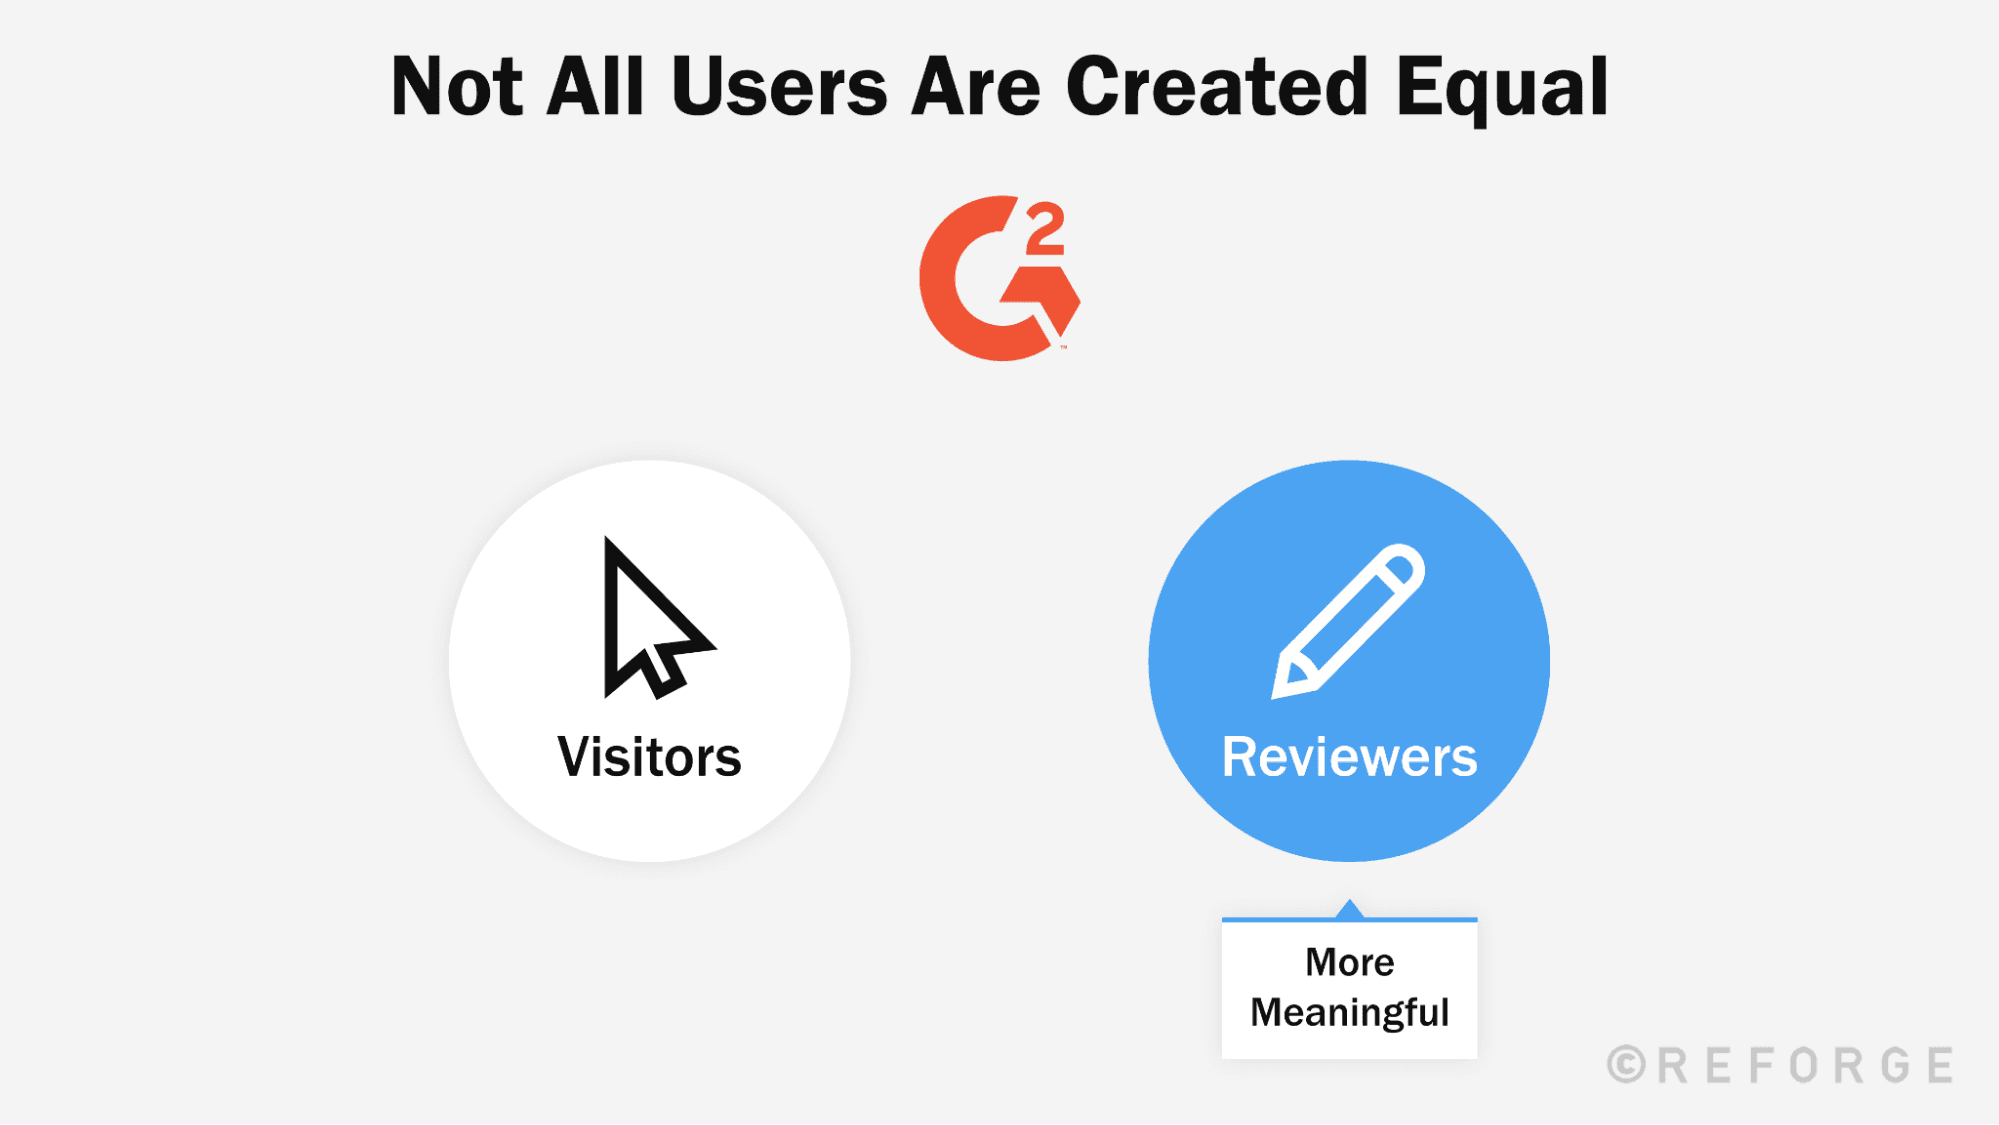
When quality measures are either missing or defined too broadly, your North Star Metric can actually incentivize the wrong user action.
In our G2 example, if we didn't specify that we’re focusing on reviewers, we’d create a misaligned incentive for the team. The metric would incentivize visitors when, really, your strategy needs reviewers to impact the business. This misaligned incentive might ultimately drive users away from the platform and stall growth.
So clearly, we need a quality measure in our North Star Metrics.
For acquisition, there are four key ways to define quality: user type, intent, behavior, or level of monetization.
For retention, quality involves defining the right core behavior, as well as the user who we consider to be our “active users.”
And for monetization, we need to define whether we are looking at recurring or non-recurring revenue, and then determine whether we want to look at total revenue, breadth, or depth.
We’ll go in depth on each of these quality measures further below.
3. Define a frequency, or relevant time frame for your North Star
Frequency measures set a timeframe during which you'll observe a behavior.
Frequency measures need to align with certain elements of each North Star Metric:
For acquisition: Your product’s consideration cycle
For retention: Your product-use frequency
And for monetization: Your billing cycle
We want to evaluate metrics over a predetermined, consistent frequency in order to be able to track changes over time. The frequency you pick for evaluation can have a big impact on the metric you are measuring.
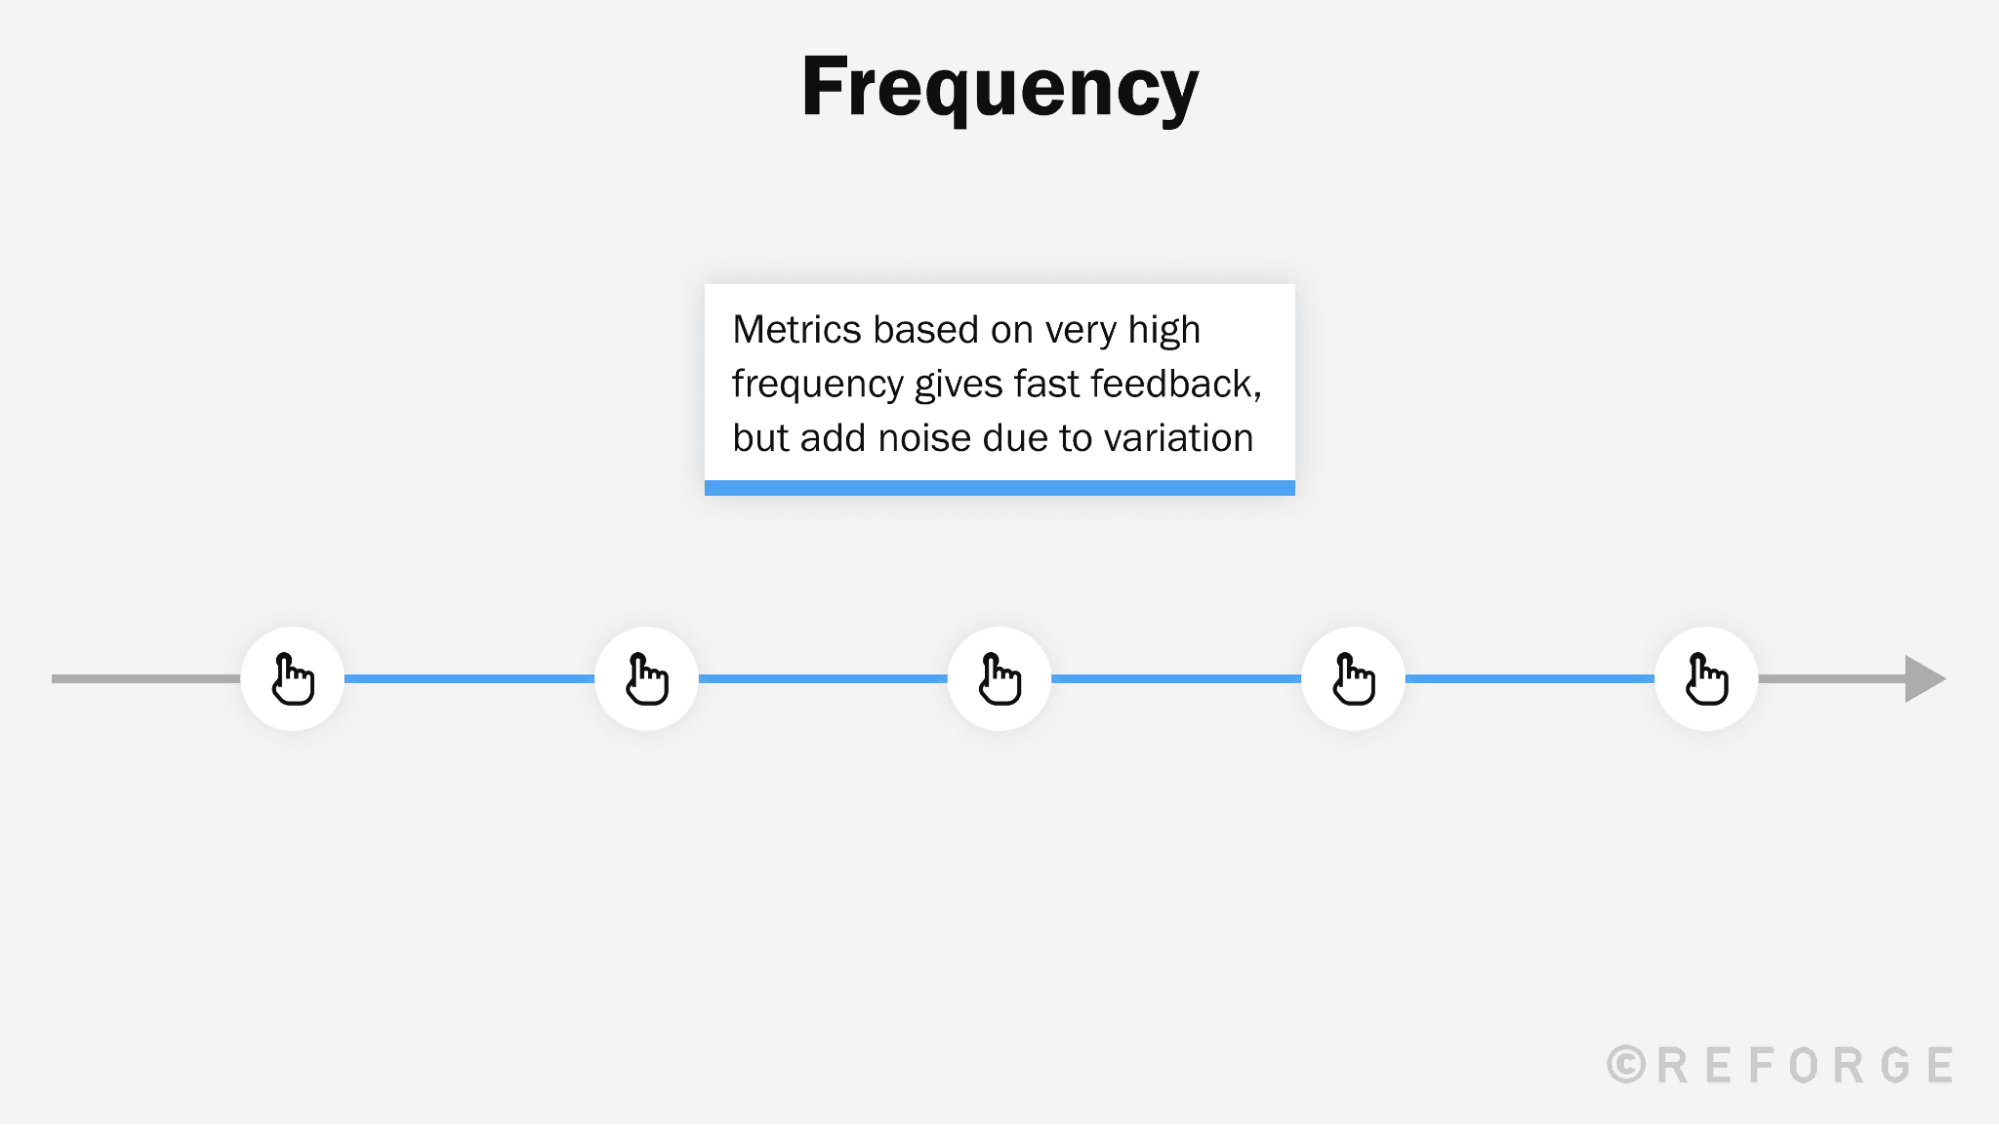
Measuring metrics based on very high frequency, like daily or hourly, can give you fast feedback on metric performance. However, if the frequency is too high, they can result in a lot of noise due to variation.
Metrics with high frequencies create incentives to have multiple touchpoints with your users and customers. But if the frequency of your metric is too high, your strategy might result in a user experience that has too many touchpoints, and ends up feeling like spam.
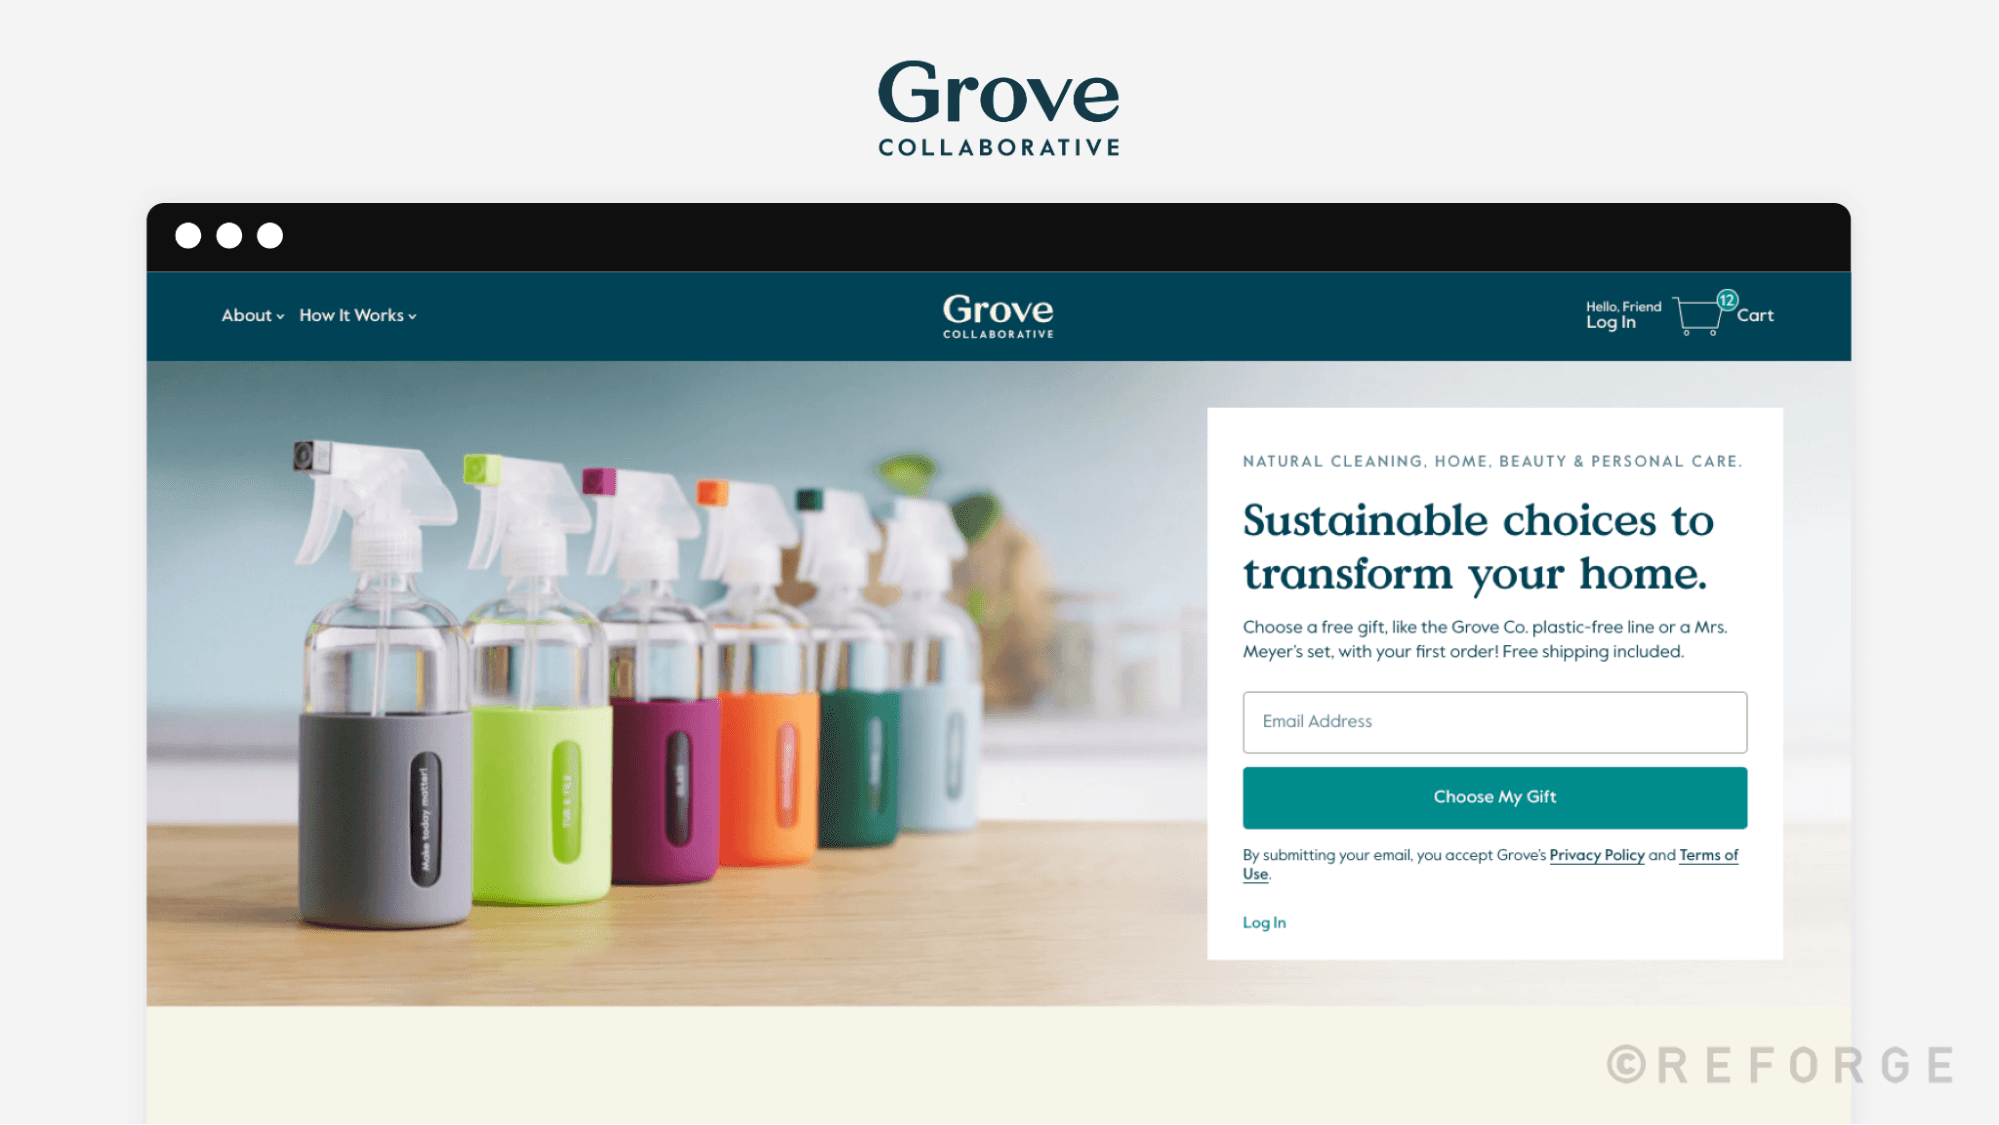
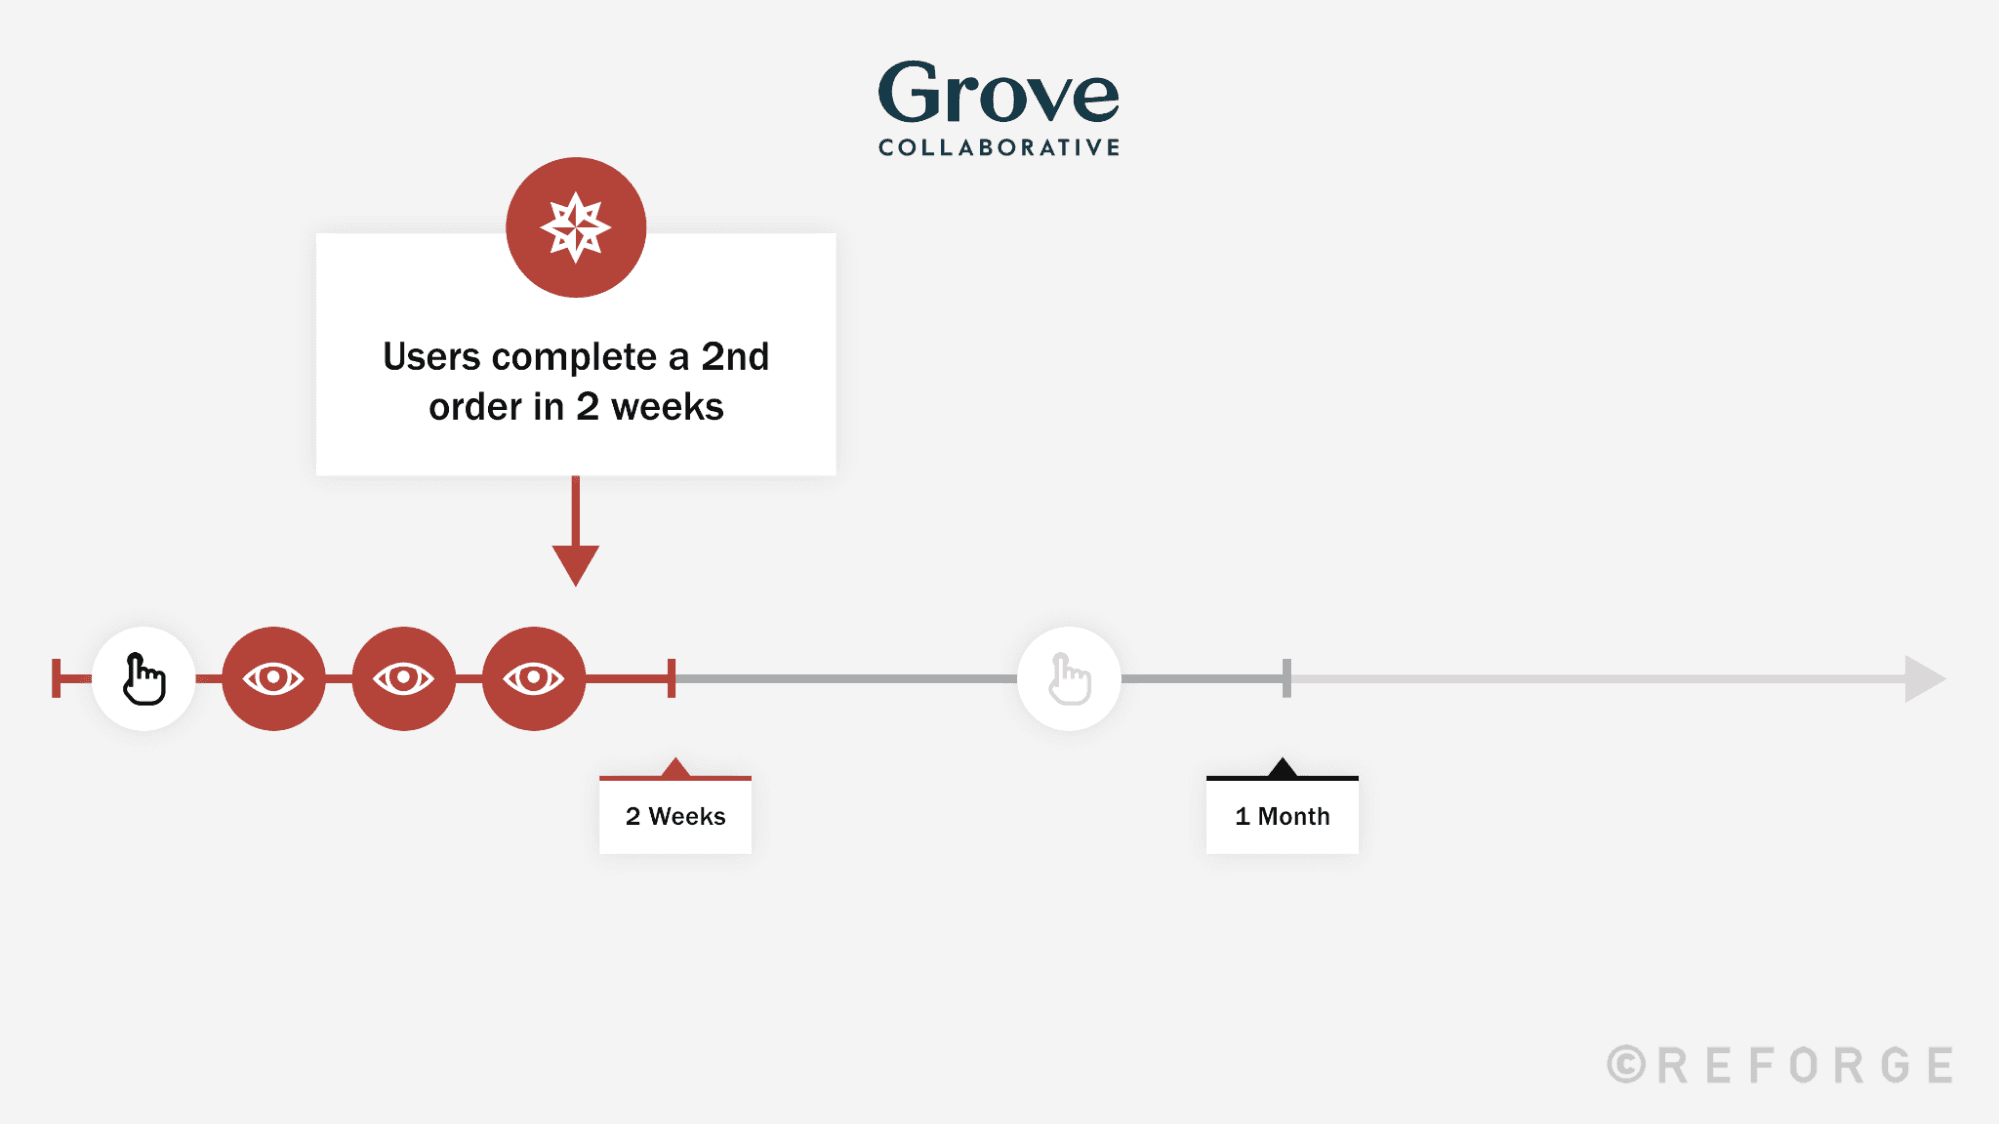
Let’s take Grove Collaborative as an example. Grove is a D2C business that sells natural household and personal care products. One of Grove’s North Star Metrics was defined as users who complete a second order by a given date. An idea they experimented with was trying to get users to complete a second order by an even sooner date.
For the sake of this example, let’s assume that they were trying to change the metric from users who complete a second order within a month to users who complete a second order within two weeks.
This change led the team to organize marketing programs and tactics to drive engagement on a more aggressive timeline.
What Grove’s brand marketing team found is that this actually turned off users who weren’t yet ready to make another purchase, but would have otherwise returned for that second order at a later date.
Measuring metrics based on lower frequencies can smooth variations out; these can be especially helpful if you need a longer window to observe a meaningful trend.
It’s important to note that measuring based on lower frequencies also presents tradeoffs. These frequencies can take longer to show impact, due to long lead times.
And if you build a strategy around a frequency that is too low, you may not have enough touchpoints and users might forget about the product.
So we want the frequency of our North Star Metric to align with the natural frequency in our use case. This allows for a better balance between the natural behaviors of the target audience and the way our multi-channel strategy nurtures behavior.
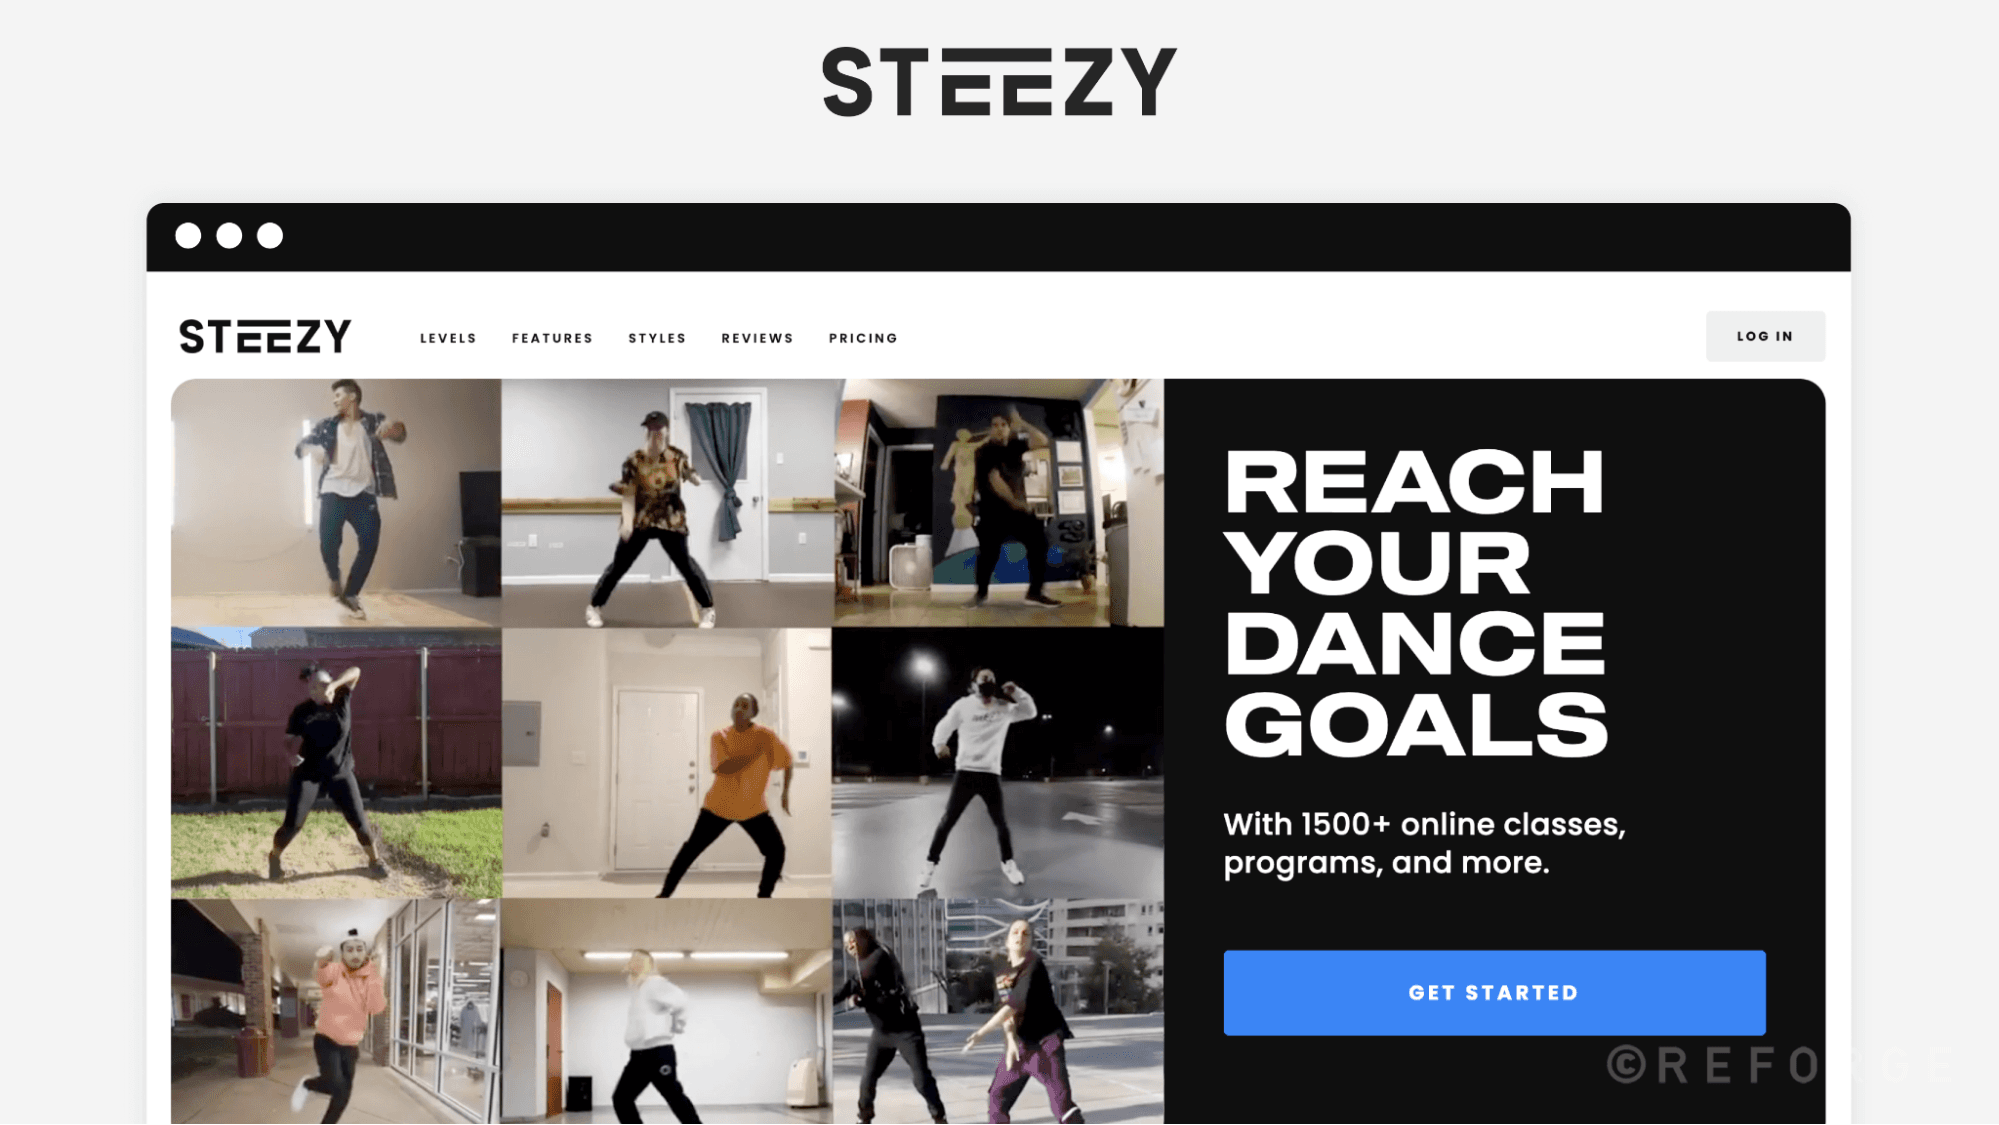
Let’s use the product Steezy as an example. Steezy is a subscription product that offers virtual dance classes in a variety of styles.
The core Steezy user might naturally visit the platform for a class once or twice a week, and stay within a dance style that they’re familiar with. We can nurture these behaviors through our channels to bring dancers back to the platform more frequently, so that they can try other styles and see the breadth of the offering.
In an effort to nurture dancer behavior to hit the North Star Metric frequency, Steezy might start sending lots of emails, and the product will begin to overwhelm the user.
However, if the frequency in the metric is too low, their nurture outreach might get less frequent, and their dancers might forget about the platform, or shift their habit to other alternatives, like YouTube. It could also be hard to see meaningful changes in behavior if the metric is too infrequent.
Let’s walk through the three steps again, in more depth, for each of the North Star Metrics
How to Choose Acquisition Metrics
1. Define your “unit of value.”
Unit of value measures "what" value we are creating. For acquisition, your unit of value should capture your volume of new users.
2. Establish the quality for your unit of value.
When it comes to acquisition, there are four key ways to define quality:
**User type: **Users that take different actions in your growth model
Intent: The likelihood of different users to convert to paying customers
**Behavior: **Different ways for users to retain or engage with the product
Level of monetization: How users monetize differently, depending on the monetization strategy.
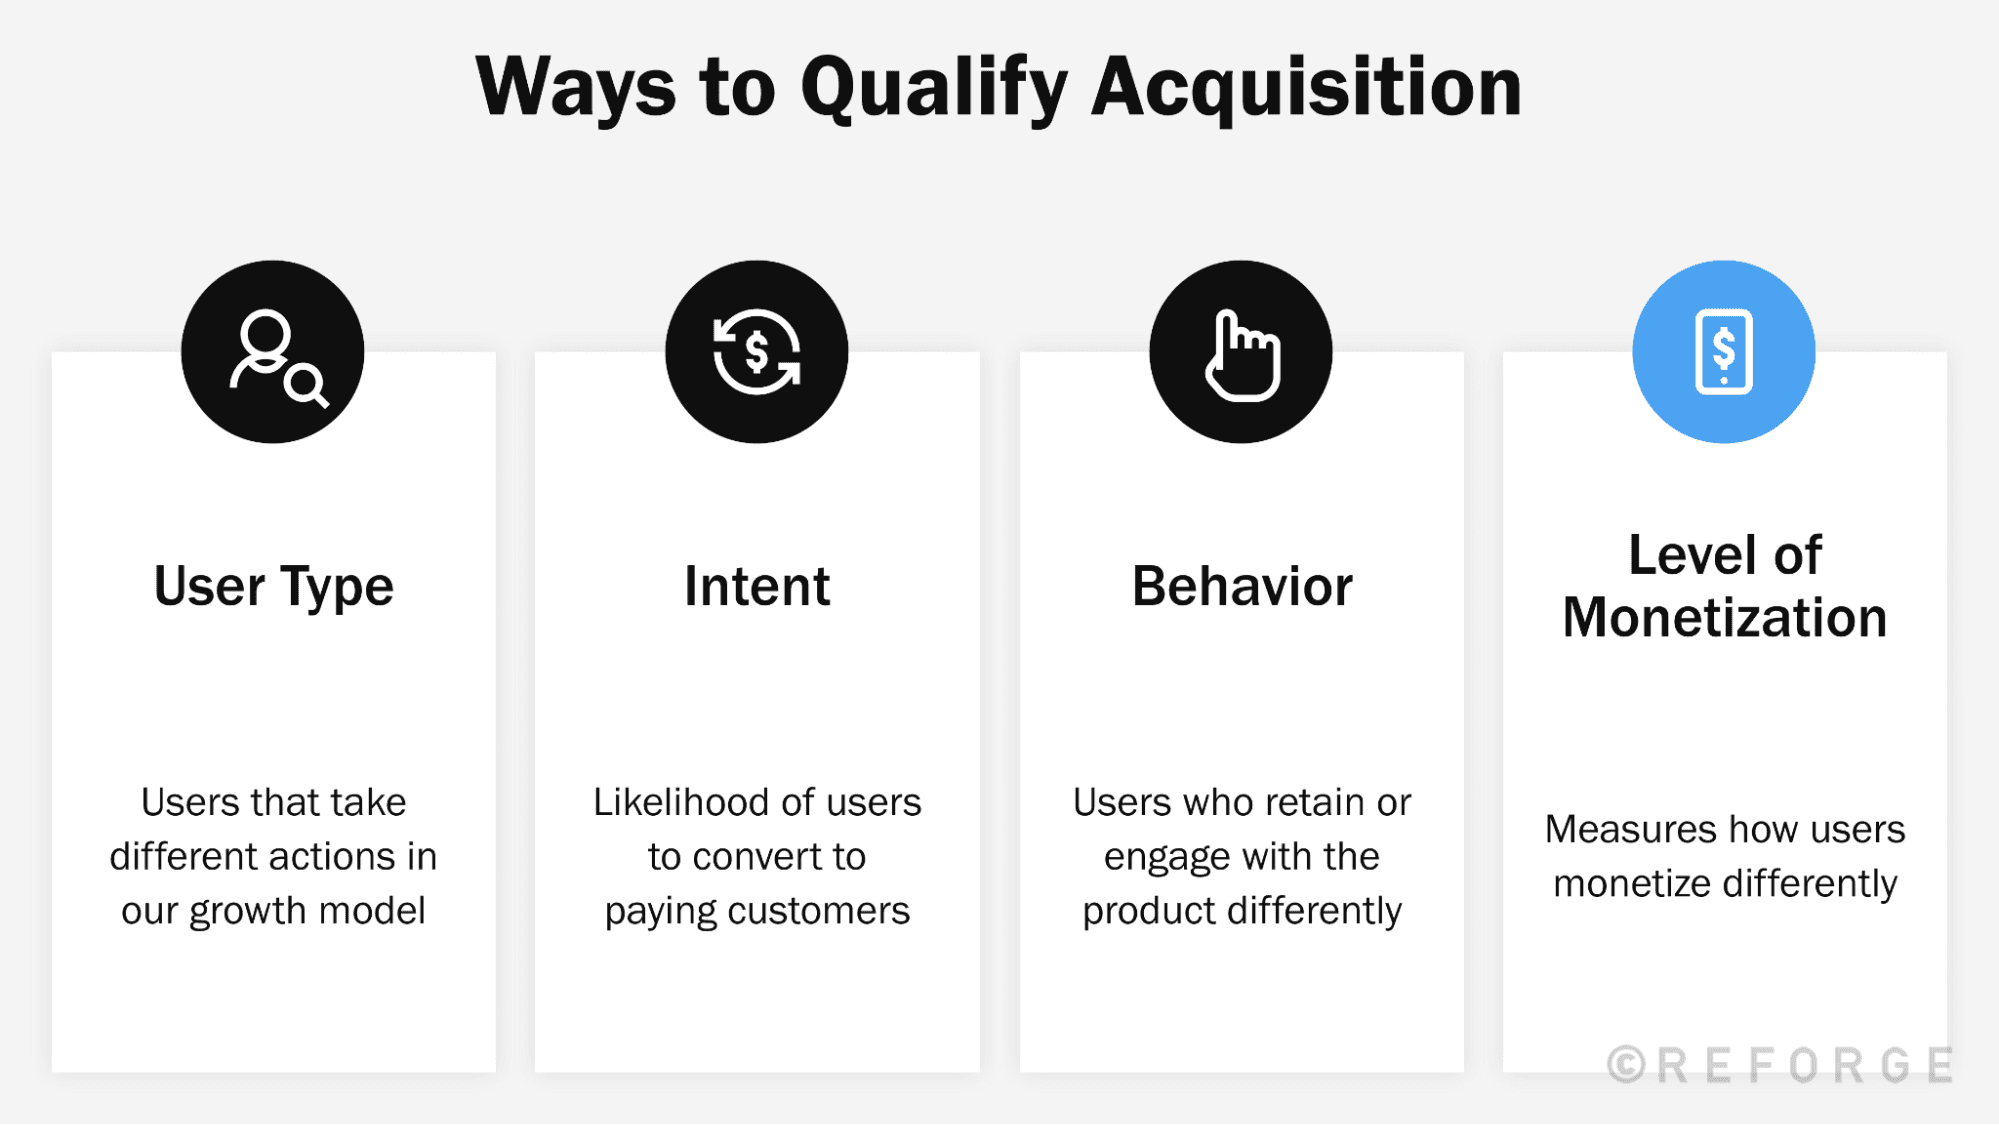
User Type
With user type, we’re specifying users that take different actions in our growth model. We can look at a product like Yelp to see an example of this in action.
Yelp relies on a user-generated content loop for growth, and a big part of this loop is people who create content by leaving reviews.
If the unit of value is “new users,” Yelp would qualify the unit of value to specify what type of new users they're looking for. So the qualified unit of value becomes “new reviewers.”
Sometimes user type is about defining the relevant subset of users, such as “new reviewers,” and other times it is just about setting a clear definition of who your user is, like deciding what constitutes an “account.”
Intent
The next way to qualify acquisition is intent, which specifies the likelihood of different users to convert to paying customers. This is common for products with longer buying or usage cycles, or those that require a human contact point in the loop, such as products that grow via sales loops.
An example of this could be HubSpot. A North Star Metric at HubSpot would focus on leads that have a high likelihood of converting into a HubSpot customer.
If the unit of value for HubSpot is “new leads,” HubSpot would qualify the unit of value to specify that they want leads that are likely to convert. So the qualified unit of value becomes “new qualified leads,” and would include a score based on their company size, the number of employees they have, their industry, or other factors.
Behavior
The next way to qualify acquisition is via behavior, which describes users who retain or engage with the product differently.
For example, in a freemium product like Spotify, it's important that we're not just driving new users, but more specifically, new activated users with an established habit around the product. If they've never established the habit, they're unlikely to continue using the product and eventually upgrade.
So rather than just looking at new sign-ups, we want to look at new activated users within the product.
Level of Monetization
And finally there's the level of monetization, which measures how users monetize differently, depending on the monetization model.
Looking at Fortnite, a free-to-play game, we can see that users generated $27 of revenue per month on average in 2020. However, this average rate per user accounts for a highly varied population of users, including both free and paid users.
Therefore, Fortnite might qualify their acquisition outcome metric, so that users must hit a specific purchase threshold to “count” in their measurement. Once they’ve done this, Fortnite can focus their efforts on acquiring new users who are more likely to transact.
3. Define a frequency, or relevant time frame, for your North Star metric.
As we mentioned before, your acquisition metric’s frequency measure needs to align to the consideration cycle for your product. The ideal frequency measure is the shortest window possible to smooth out normal variation.
How to Choose Retention Metrics
1. Define your “unit of value.”
Unit of value measures "what" value we are creating. For retention, it should capture your “active” users.
2. Establish the quality for your unit of value.
Retention quality measures are less prescriptive than acquisition quality measures. While acquisition quality measures are more about filtering different types of new users in a few key ways, retention quality is determined by the rigor with which you define “active users” based on your product and growth model.
Since retention North Star Metrics focus on active users, our quality measure should set a standard for who counts as retained from the perspectives of both breadth and depth.
Reforge members go into much deeper detail on this in the Retention and Engagement program, but here’s an overview:
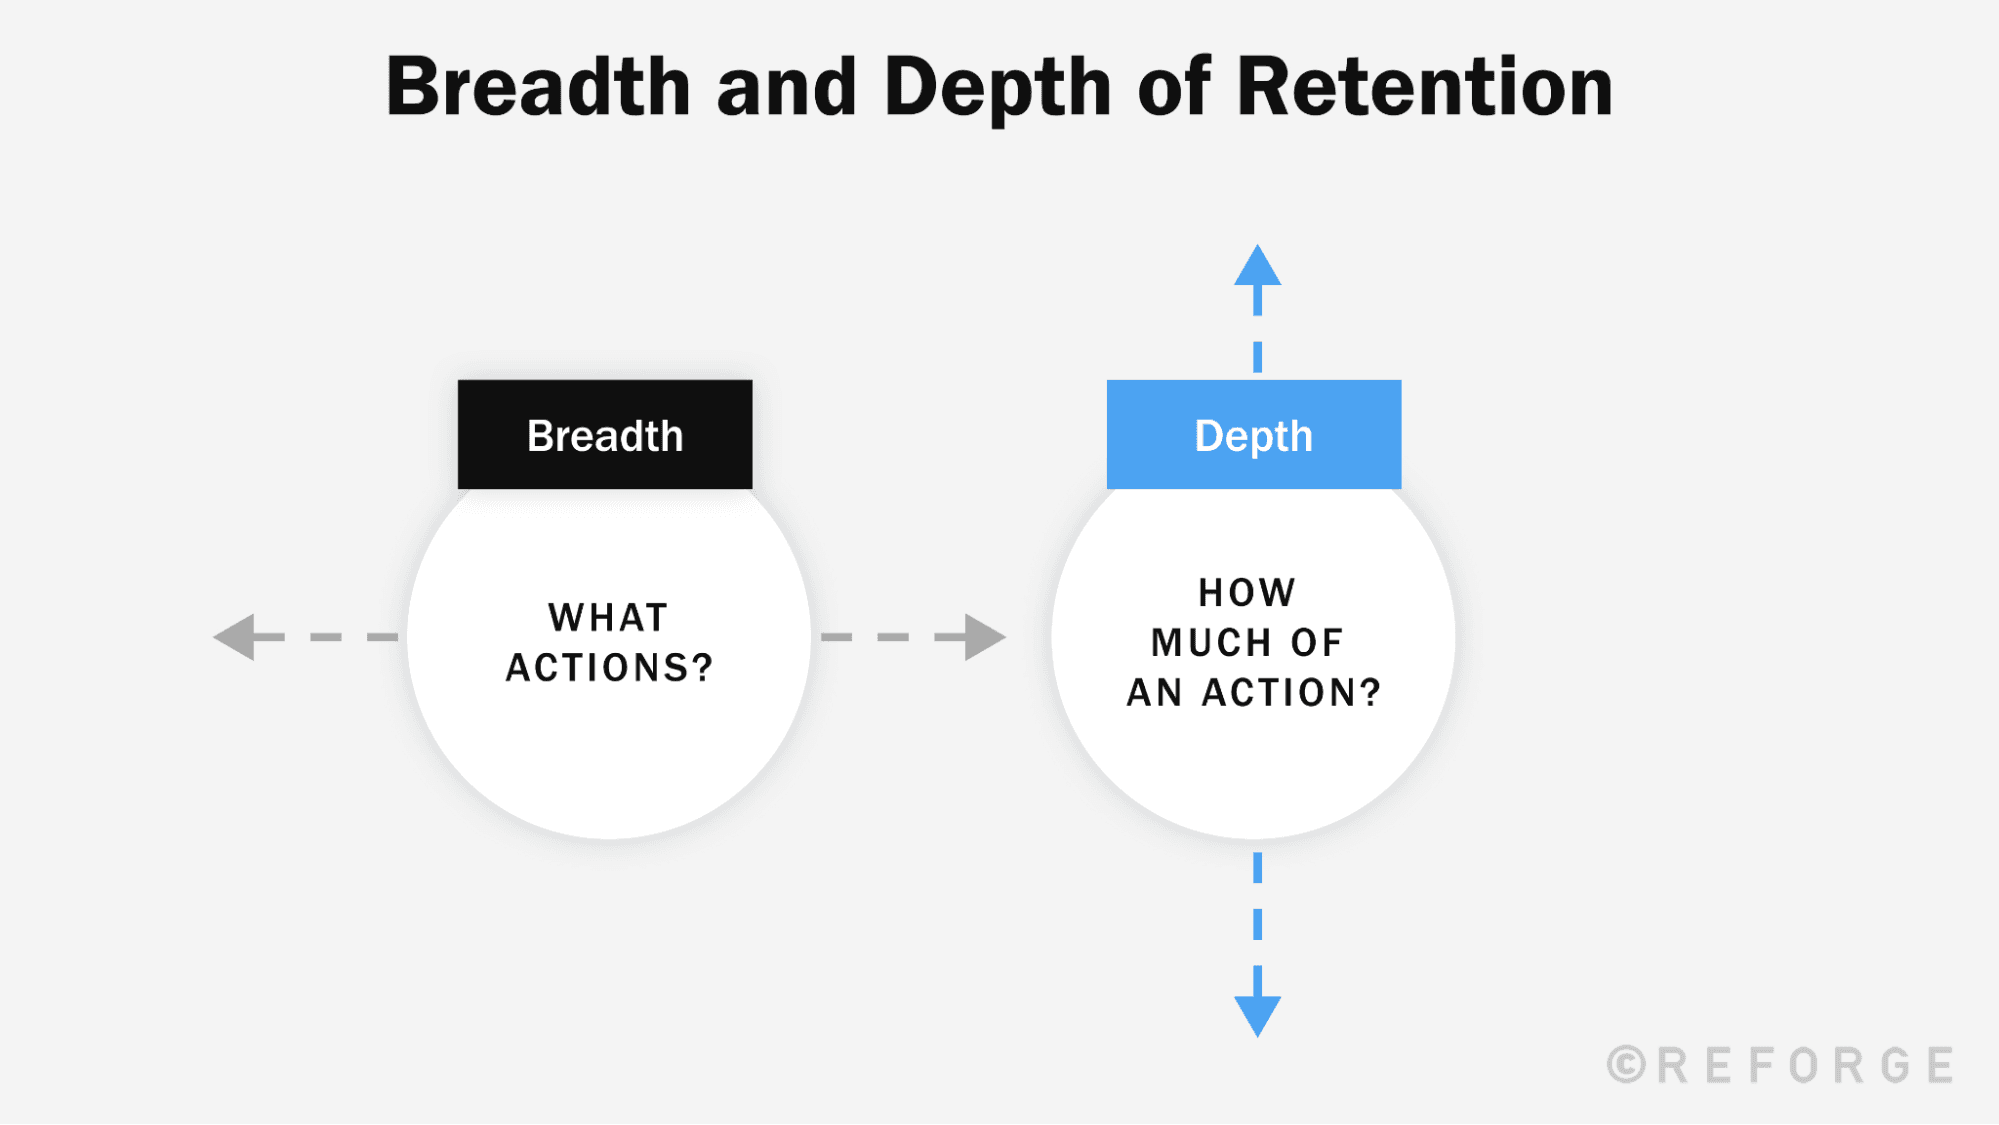
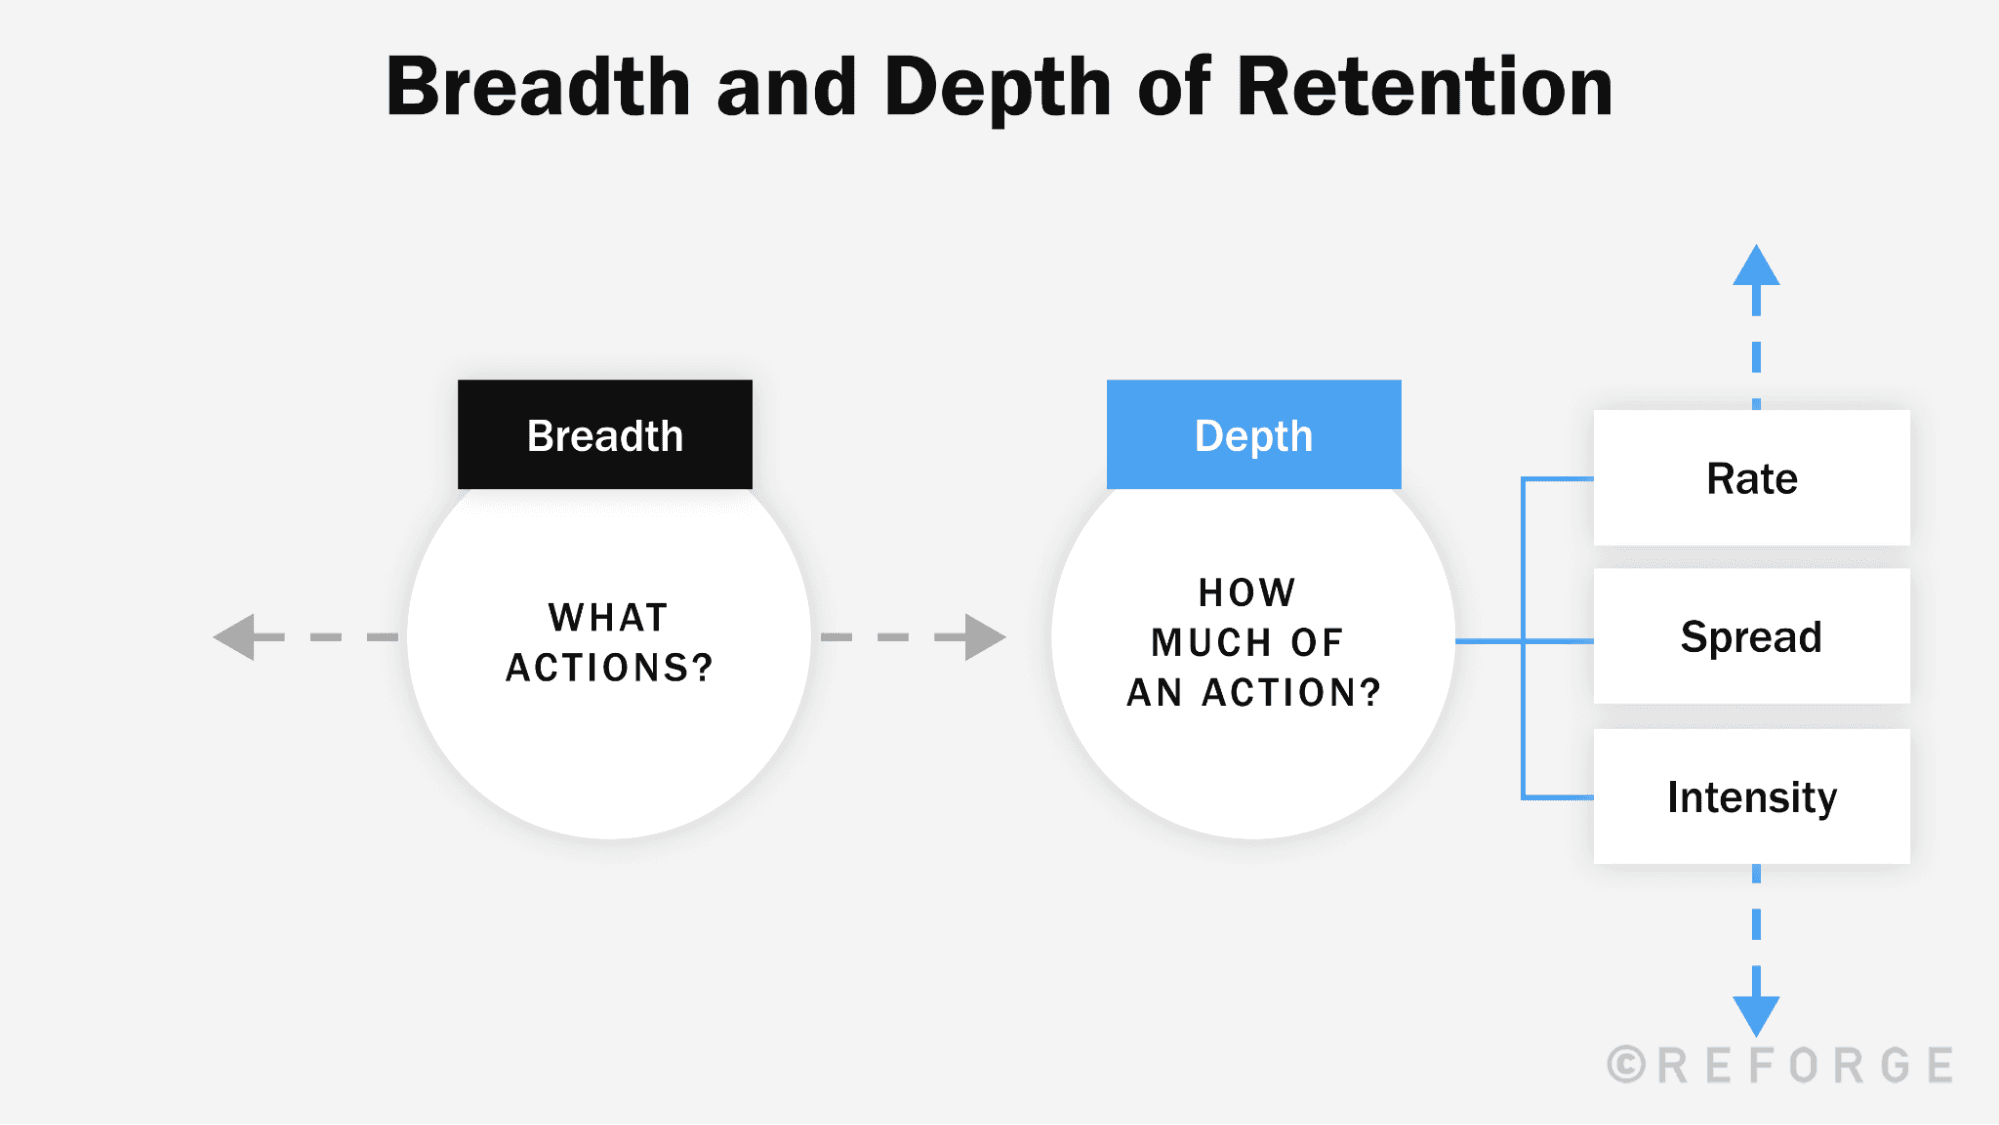
First, we should ask what actions need to be taken to count as retained. These actions should be rooted in the core behavior within your product’s habit loops to define a retention North Star Metric for quality. This question helps us gauge** breadth**, which represents the number of users who are doing an action.
Second, we need to decide how much of an action needs to be taken in order for someone to count as retained. This question helps us gauge depth, which represents how engaged people are in the product.
Depth of engagement is a spectrum of behavior that considers three things:
Rate of use
Spread of usage across features or products
Intensity of use
Let's walk through an example of each one of these depth components to see how they're different:
Rate of Usage
Pinterest’s engagement strategy is to build the rate of use of the product. In other words, they want users to be coming back to the product as many days as possible, and really establishing the habit.
As a result, the depth of their engagement is measured in the number of days they were active within some time period. This could potentially be expressed as an L7 metric, meaning the average number of days a user was active within the last seven days.
We can also look at longer time periods, like L28, which would say the average number of days active within the last 28 days. Here, to improve engagement, we would be trying to increase the number of days that user was active within that time period.
Spread of usage across features or products
We can also look at engagement as a spectrum of feature usage. This is common in B2B products, where we have a large number of features that solve a number of use cases, and retention is tied to usage of the product. In other words, how many of those features or use cases has the user established a habit around?
Let’s look at an example around HubSpot. In their case, the features we’d be looking at might include email marketing, ad monitoring, and social reporting, and we could look at engagement in terms of the average number of features a customer uses within some time period. Improving the number of features that they use within some time period would lead to increases in long-term retention.
Intensity of use
We can also think about engagement in a third way, which is intensity. This refers to how much of a specific action they do within some time period.
This is common in content products, like Netflix. Here, instead of looking at the rate of usage — or the number of days users consume content per week — we’d look at the average number of hours of content consumed per week.
3. Define a frequency, or relevant time frame, for your North Star metric.
As we mentioned before, your retention metric’s frequency measure needs to align with your product’s natural use frequency.
How to Choose Monetization Metrics
1. Define your “unit of value.”
Unit of value measures "what" value we are creating. For monetization, your unit of value should capture dollars earned.
2. Establish the quality for your unit of value.
Monetization quality measures include determining whether revenue is recurring or non-recurring, as well as determining the lens through which you measure dollars earned. This will depend on your product and monetization model.
In the case of a B2B SaaS product, like Zendesk, we'd likely be looking at monthly recurring revenue as our total monetization output. But in the case of a transactional model, such as Uber Eats, we'd likely be looking at daily, weekly, or monthly revenue, which is non-recurring.
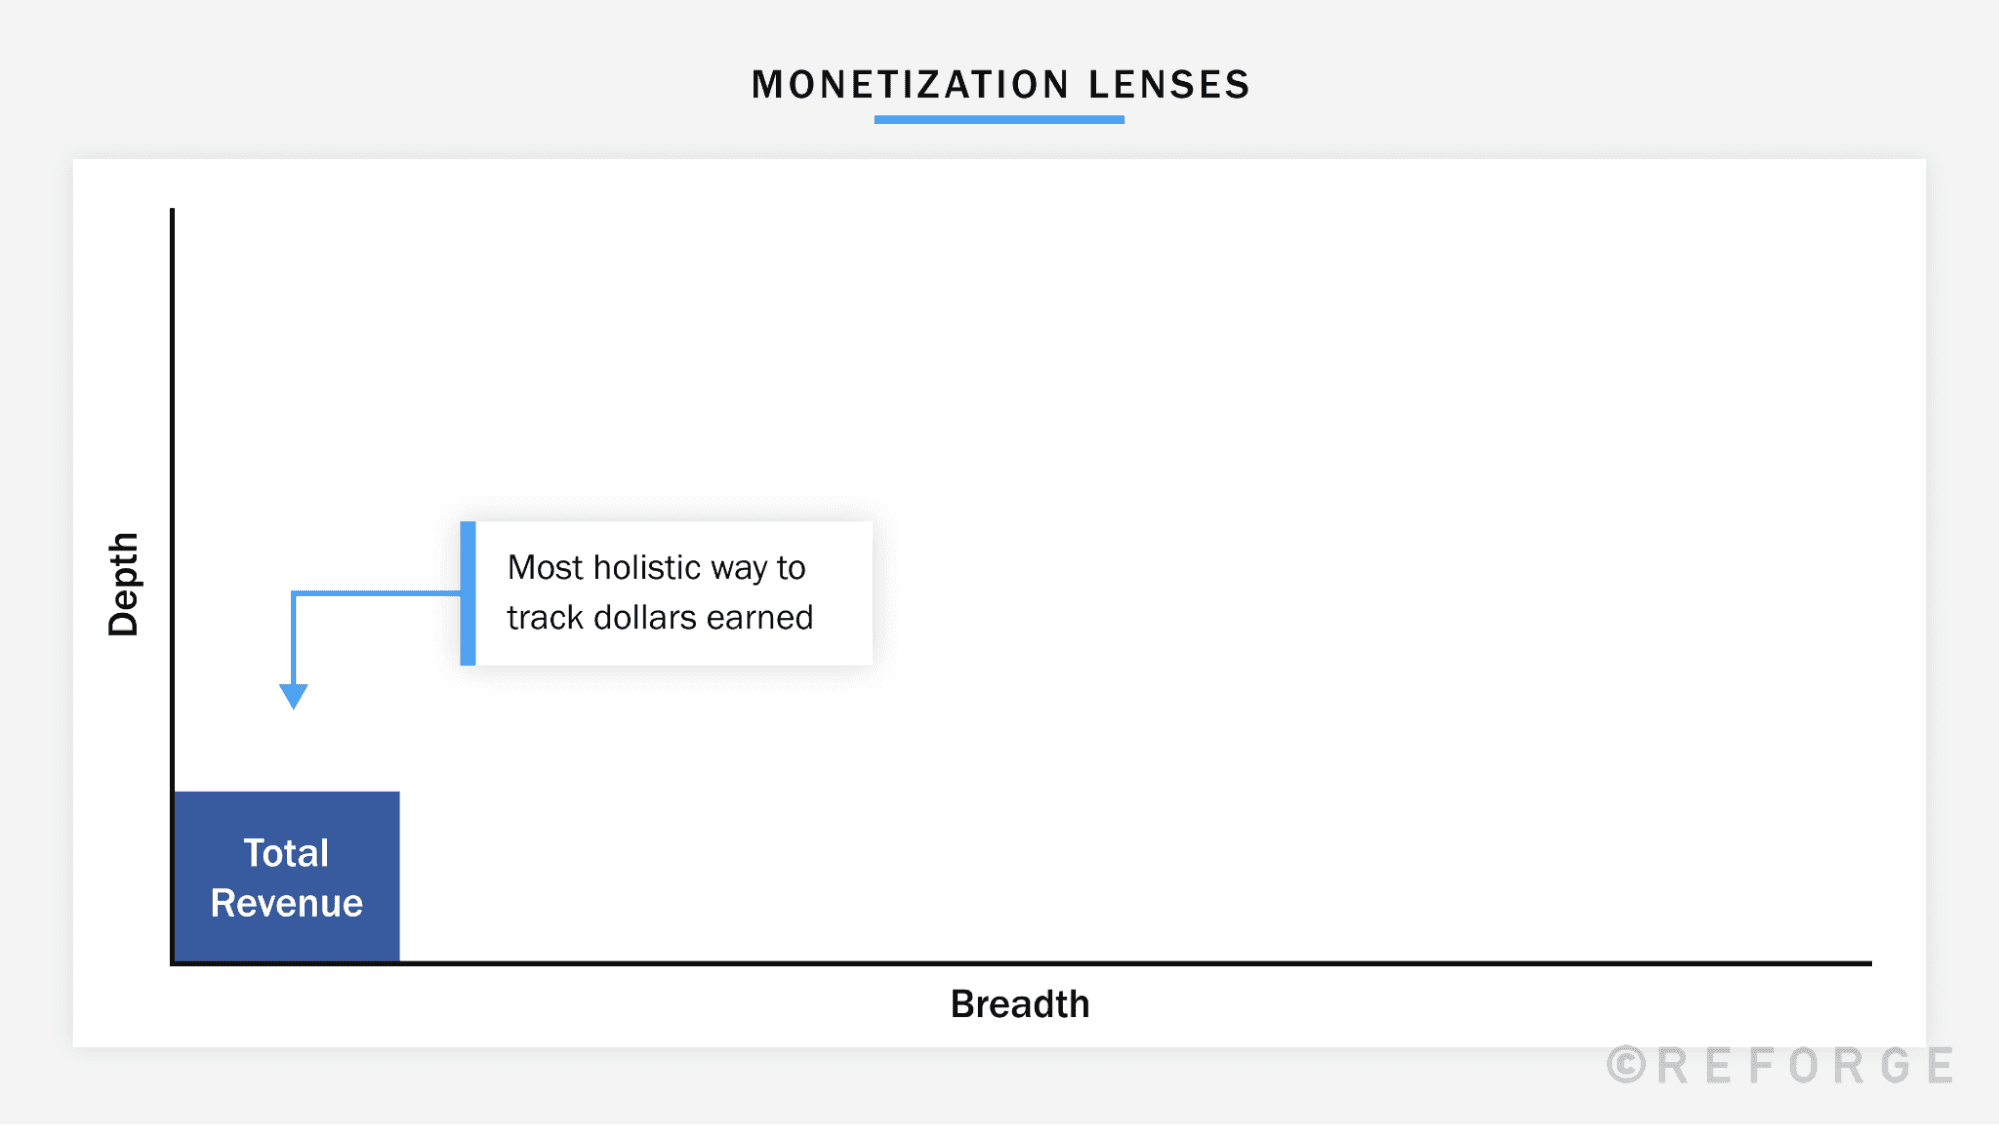
There are three different monetization lenses:
Total revenue
Breadth
Depth
Revenue is the most holistic way to track dollars earned, and as such, many marketing leaders use this as their North Star. However, you can also break revenue down into breadth and depth.
We can improve revenue either by increasing the number of paying customers within a time period, which is breadth...
...or by increasing the amount of dollars we capture from each customer, which is depth. Different customer problems and different strategic opportunities align to these two dimensions in different ways.
Let's look at an example from the food delivery app DoorDash. DoorDash is a multi-sided marketplace: diner, driver, and restaurant volume needs to be balanced. For instance, without a certain number of paying customers and orders, there won’t be enough deliveries for the drivers, and the drivers will churn from the marketplace. Similarly, restaurants might abandon DoorDash as well if they’re not seeing enough business.
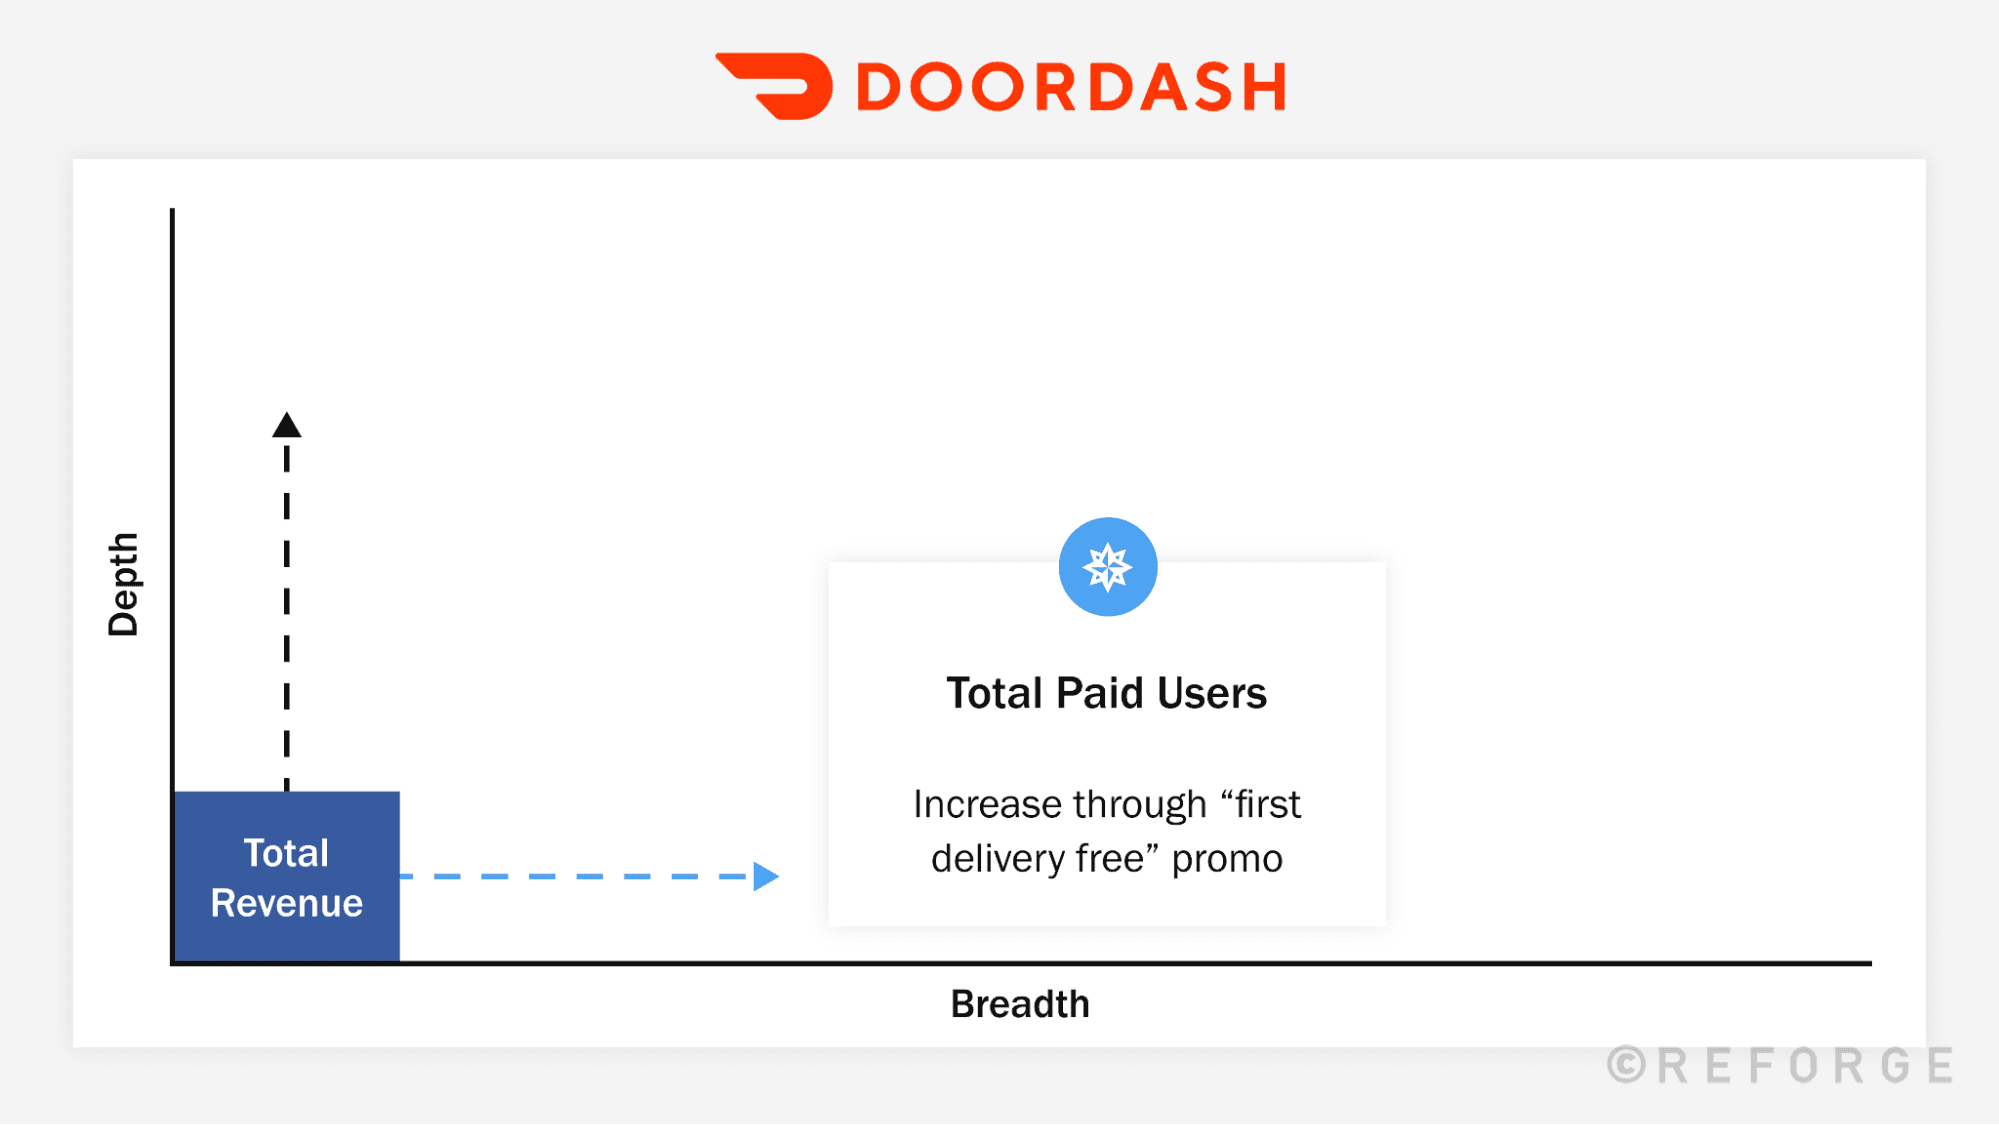
With this context, we’ll start with an example of breadth for DoorDash, where we try to increase the number of paying customers. That’s because more diners and orders leads to greater demand for drivers and restaurants, which improves the overall balance of the marketplace.
So in this example, we might leverage brand marketing to focus on increasing the number of paying customers within a time period, rather than on total revenue or dollars per customer. To incentivize new customers to use DoorDash, they could implement a “first delivery free” promotion. This, as a result, could help DoorDash reach its goal of increasing the number of paying users.
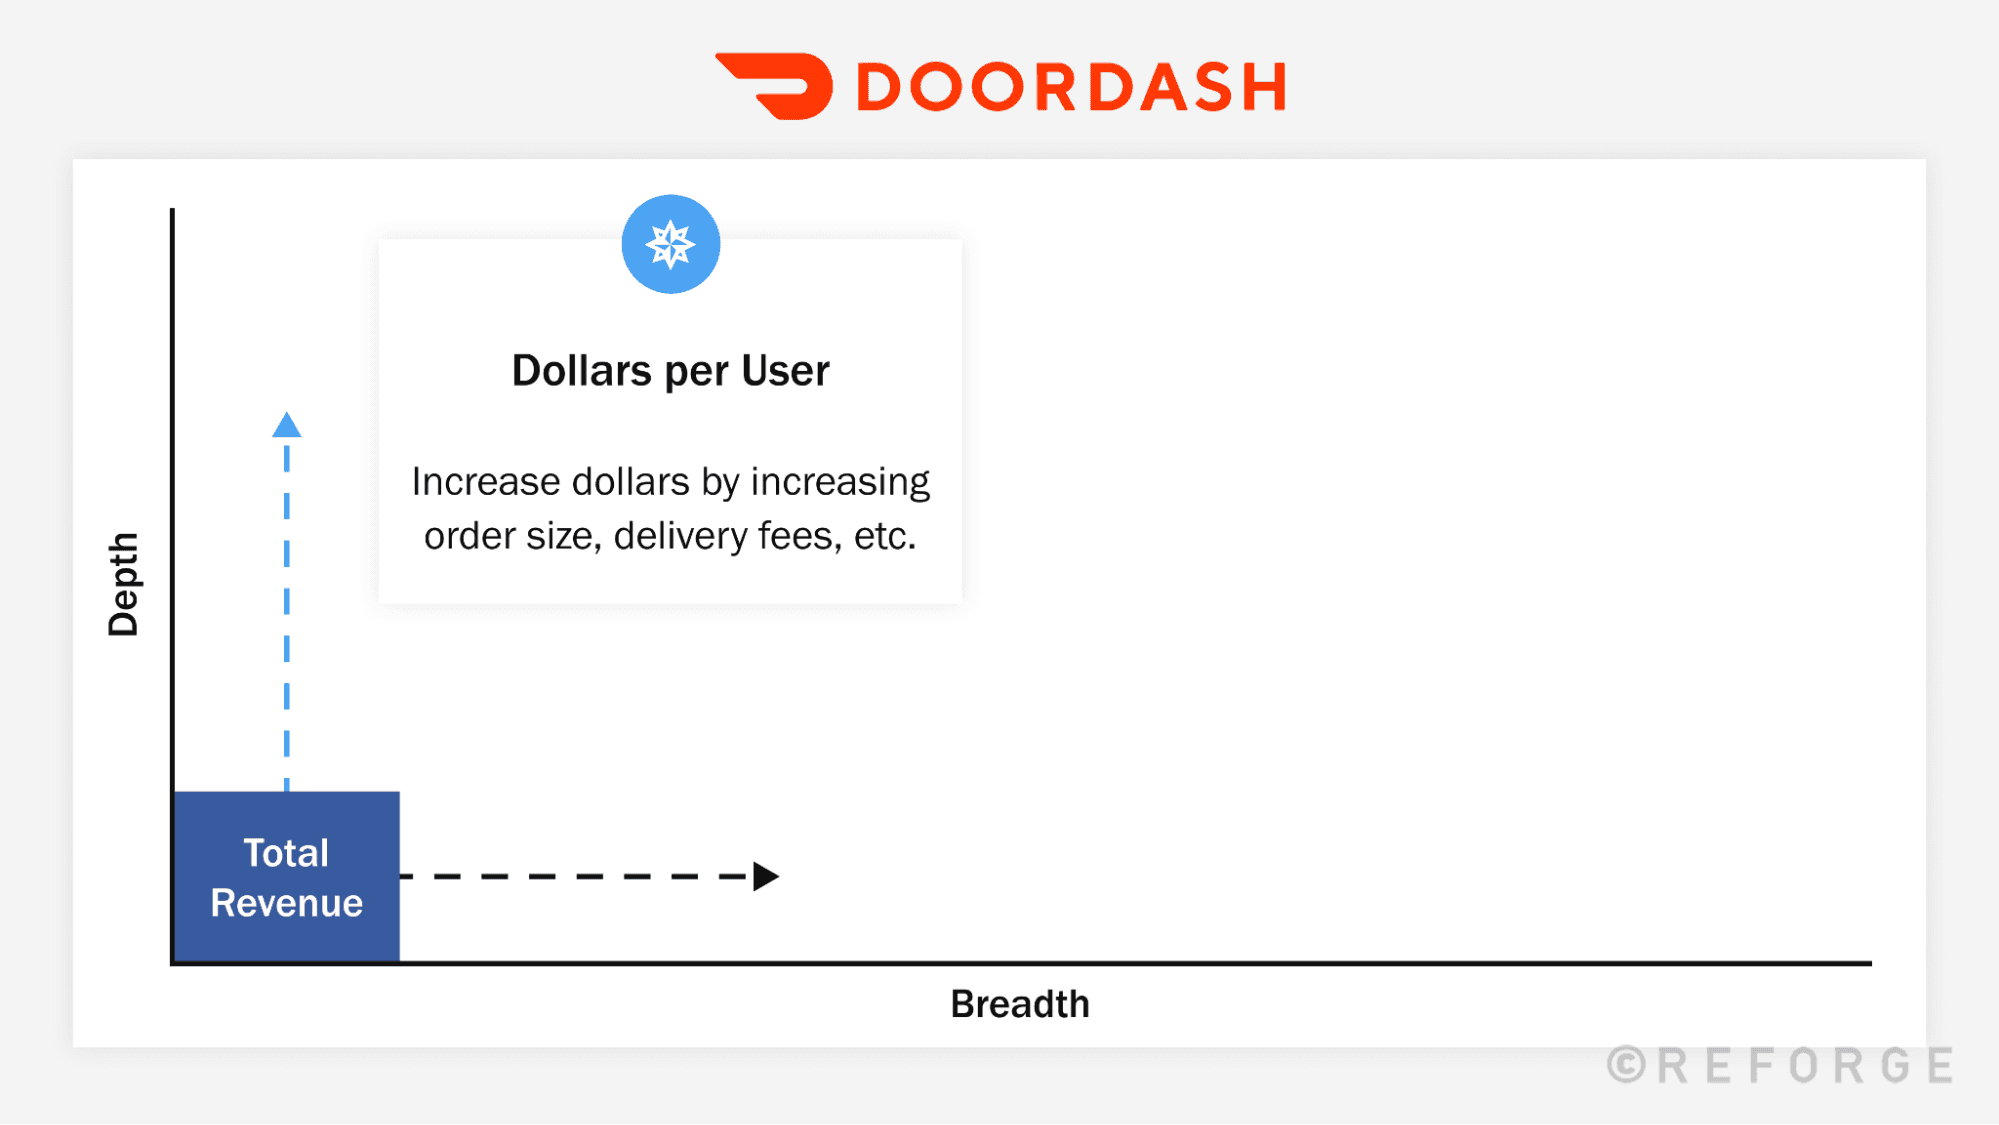
We can also look at an example of depth for DoorDash, where we try to increase the number of dollars we get from each paying customer. It's possible we might identify brand marketing opportunities that align more to increasing order size, increasing delivery fees, or other methods of capturing more dollars per customer.
3. Define a frequency, or relevant time frame, for your North Star metric.
As we mentioned before, your monetization metric’s frequency measure should align with your product’s billing cycle — i.e. the natural frequency of payments, which may or may not be tied to actual product usage.
North Star Metrics Template
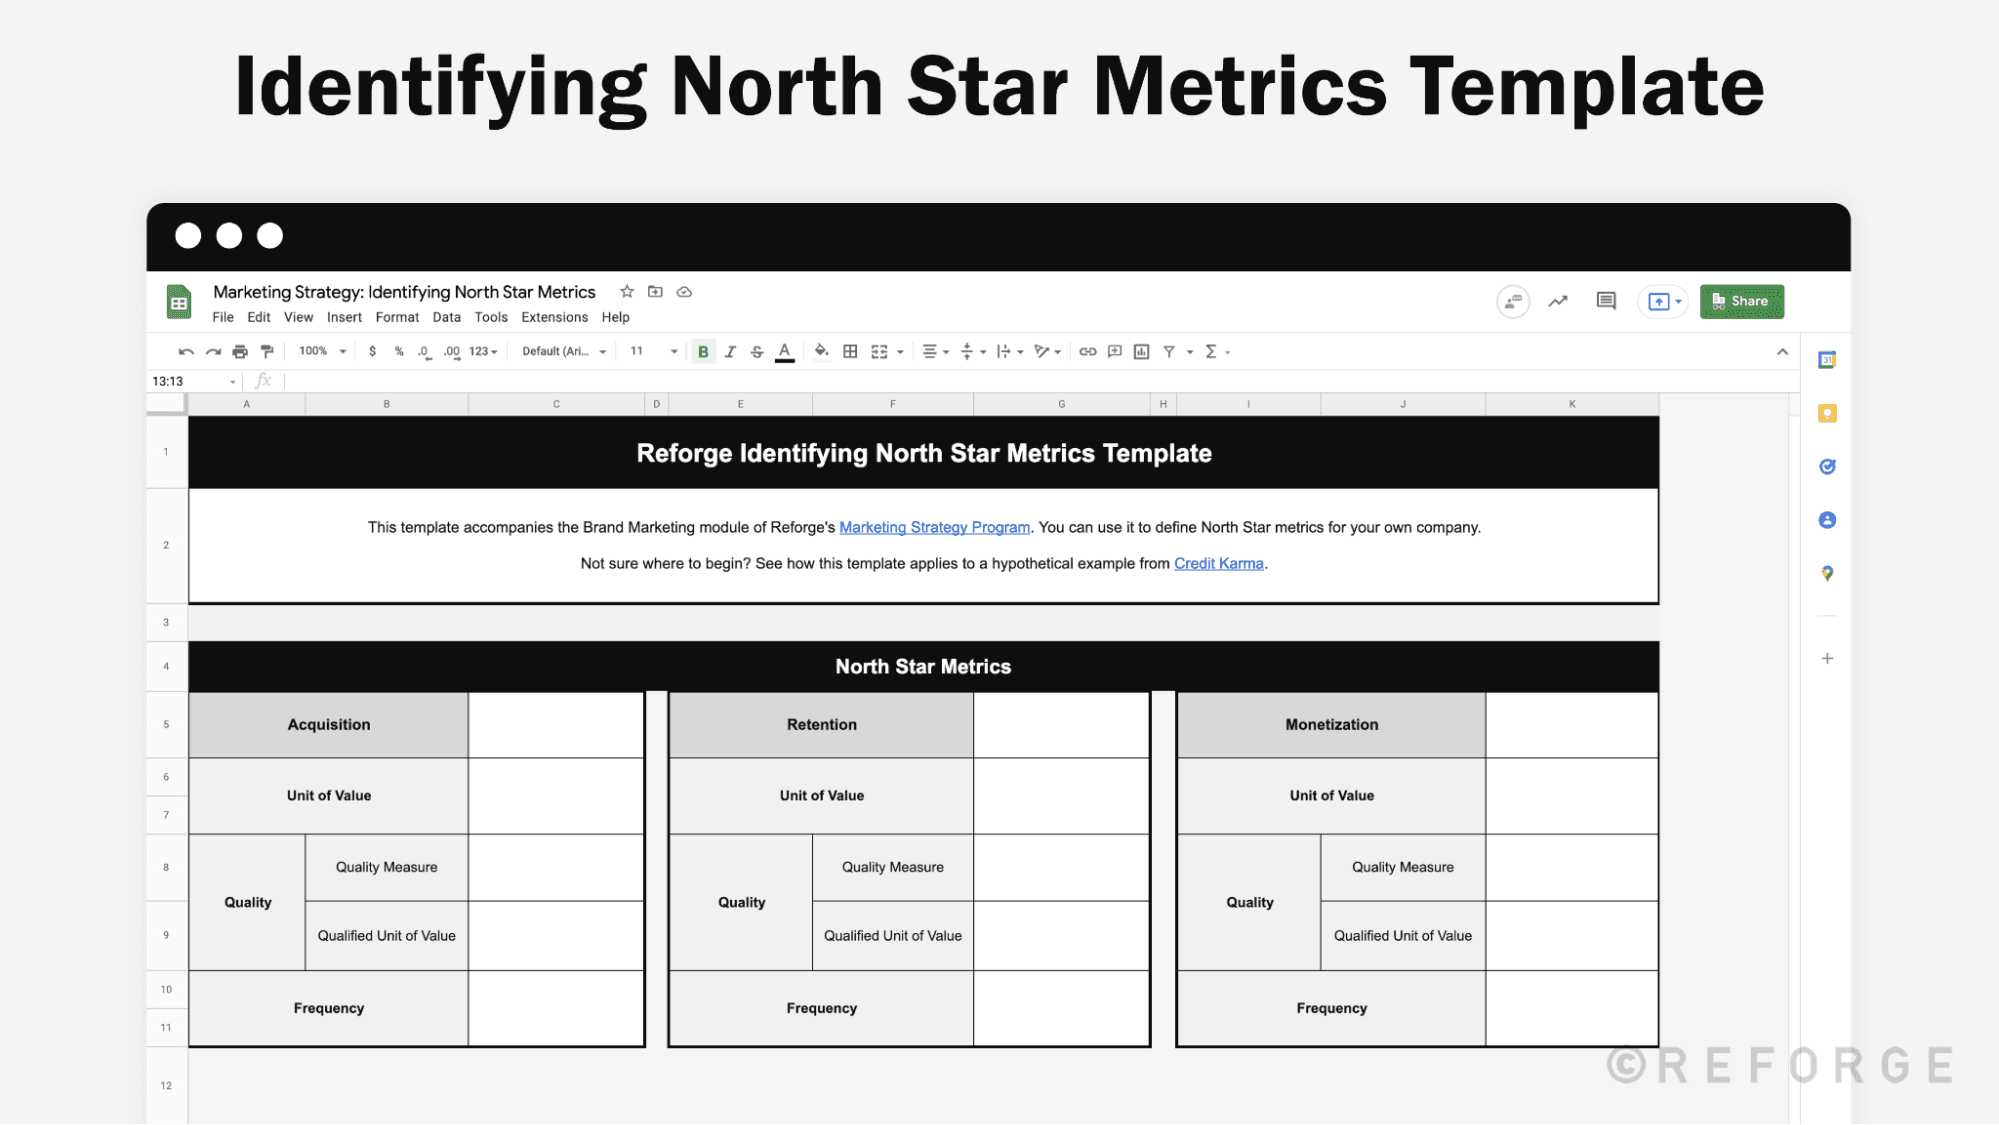
We’ve covered the three components of our North Star Metrics: unit of value, quality, and frequency.
If you’re a Reforge member, you can use the Identifying North Star Metrics template to define your own North Star Metrics. (We’ve also included an example based around Credit Karma in the template.)